Top Rankings
Seattle School District No. 1 ranks among the top 20% of public school district in Washington for:
Category
Attribute
Overall Rank
Highest overall rank (Top 10%)
Math Proficiency
Highest math proficiency (Top 10%)
Reading/Language Arts Proficiency
Highest reading/language arts proficiency (Top 10%)
Diversity
Most diverse schools (Top 1%)
Community Size
Largest student body (number of students) (Top 1%)
For the 2024 school year, there are 92 public elementary schools serving 36,355 students in Seattle School District No. 1. This district's average elementary testing ranking is 10/10, which is in the top 5% of public elementary schools in Washington.
Public Elementary Schools in Seattle School District No. 1 have an average math proficiency score of 68% (versus the Washington public elementary school average of 50%), and reading proficiency score of 77% (versus the 59% statewide average).
Minority enrollment is 55% of the student body (majority Black and Hispanic), which is more than the Washington public elementary school average of 51% (majority Hispanic).
Overview
This School District
This State (WA)
# Schools
109 Schools
1,848 Schools
# Students
51,443 Students
728,286 Students
# Teachers
3,246 Teachers
45,625 Teachers
Student : Teacher Ratio
16:1
16:1
District Rank
Seattle School District No. 1, which is ranked within the top 5% of all 300 school districts in Washington (based off of combined math and reading proficiency testing data) for the 2018-2019 school year.
The school district's graduation rate of 84% has increased from 77% over five school years.
Overall District Rank
#22 out of 306 school districts
(Top 10%)
(Top 10%)

Math Test Scores (% Proficient)
(18-19)64%
50%

Reading/Language Arts Test Scores (% Proficient)
(18-19)72%
61%

Graduation Rate
(18-19)83%
84%

Students by Ethnicity:
Diversity Score
0.73
0.68
# American Indian Students
192 Students
9,755 Students
% American Indian Students
1%
1%
# Asian Students
6,494 Students
62,173 Students
% Asian Students
13%
9%
# Hispanic Students
6,850 Students
183,931 Students
% Hispanic Students
13%
25%
# Black Students
7,620 Students
33,932 Students
% Black Students
15%
5%
# White Students
23,338 Students
360,206 Students
% White Students
45%
50%
# Hawaiian Students
215 Students
9,770 Students
% Hawaiian Students
1%
1%
# Two or more races Students
6,353 Students
67,249 Students
% of Two or more races Students
12%
9%
Students by Grade:
# Students in PK Grade:
743
11,783
# Students in K Grade:
3,980
76,043
# Students in 1st Grade:
3,772
74,612
# Students in 2nd Grade:
4,104
78,521
# Students in 3rd Grade:
4,028
79,256
# Students in 4th Grade:
3,961
78,860
# Students in 5th Grade:
3,967
79,997
# Students in 6th Grade:
3,613
80,030
# Students in 7th Grade:
3,814
73,535
# Students in 8th Grade:
3,735
73,807
# Students in 9th Grade:
3,955
5,309
# Students in 10th Grade:
3,719
4,938
# Students in 11th Grade:
3,882
5,057
# Students in 12th Grade:
4,170
6,538
# Ungraded Students:
-
-
District Revenue and Spending
The revenue/student of $25,329 is higher than the state median of $19,148. The school district revenue/student has grown by 16% over four school years.
The school district's spending/student of $21,662 is higher than the state median of $19,607. The school district spending/student has grown by 7% over four school years.
Total Revenue
$1,303 MM
$20,715 MM

Spending
$1,114 MM
$21,212 MM

Revenue / Student
$25,329
$19,148

Spending / Student
$21,662
$19,607

Best Seattle School District No. 1 Public Elementary Schools (2024)
School
(Math and Reading Proficiency)
(Math and Reading Proficiency)
Location
Grades
Students
Rank: #11.
Cascadia Elementary School
Magnet School
(Math: ≥99% | Reading: ≥99%)
Rank:
Rank:
10/
Top 1%10
1700 N 90th Street
Seattle, WA 98115
(206) 252-5914
Seattle, WA 98115
(206) 252-5914
Grades: 1-5
| 474 students
Rank: #22.
Stephen Decatur Elementary School
(Math: ≥95% | Reading: ≥95%)
Rank:
Rank:
10/
Top 1%10
7711 43rd Ave Ne
Seattle, WA 98115
(206) 252-3230
Seattle, WA 98115
(206) 252-3230
Grades: 1-5
| 200 students
Rank: #33.
Mcdonald International School
(Math: 86% | Reading: 95%)
Rank:
Rank:
10/
Top 1%10
144 Ne 54th St
Seattle, WA 98105
(206) 252-2900
Seattle, WA 98105
(206) 252-2900
Grades: K-5
| 454 students
Rank: #44.
Frantz Coe Elementary School
(Math: 88% | Reading: 91%)
Rank:
Rank:
10/
Top 5%10
2424 7 Av W
Seattle, WA 98119
(206) 252-2000
Seattle, WA 98119
(206) 252-2000
Grades: K-5
| 446 students
Rank: #55.
Lawton Elementary School
(Math: 83% | Reading: 87%)
Rank:
Rank:
10/
Top 5%10
4000 27 Av W
Seattle, WA 98199
(206) 252-2130
Seattle, WA 98199
(206) 252-2130
Grades: K-5
| 333 students
Rank: #66.
View Ridge Elementary School
(Math: 82% | Reading: 87%)
Rank:
Rank:
10/
Top 5%10
7047 50 Av Ne
Seattle, WA 98115
(206) 252-5600
Seattle, WA 98115
(206) 252-5600
Grades: PK-5
| 351 students
Rank: #77.
Hamilton International Middle School
(Math: 81% | Reading: 88%)
Rank:
Rank:
10/
Top 5%10
1610 N 41 St
Seattle, WA 98103
(206) 252-5810
Seattle, WA 98103
(206) 252-5810
Grades: 6-8
| 924 students
Rank: #88.
Greenwood Elementary School
(Math: 75-79% | Reading: 90-94%)
Rank:
Rank:
10/
Top 5%10
144 Nw 80 St
Seattle, WA 98117
(206) 252-1400
Seattle, WA 98117
(206) 252-1400
Grades: PK-5
| 316 students
Rank: #99.
Fairmount Park Elementary School
(Math: 82% | Reading: 86%)
Rank:
Rank:
10/
Top 5%10
3800 Sw Findlay St
Seattle, WA 98126
(206) 252-9290
Seattle, WA 98126
(206) 252-9290
Grades: PK-5
| 437 students
Rank: #1010.
West Woodland Elementary School
(Math: 80% | Reading: 86%)
Rank:
Rank:
10/
Top 5%10
5601 4 Av Nw
Seattle, WA 98107
(206) 252-1600
Seattle, WA 98107
(206) 252-1600
Grades: K-5
| 403 students
Rank: #1111.
Wedgwood Elementary School
(Math: 81% | Reading: 85%)
Rank:
Rank:
10/
Top 5%10
2720 Ne 85 St
Seattle, WA 98115
(206) 252-5670
Seattle, WA 98115
(206) 252-5670
Grades: K-5
| 393 students
Rank: #12 - 1412. - 14.
B F Day Elementary School
(Math: 75-79% | Reading: 85-89%)
Rank:
Rank:
10/
Top 5%10
3921 Linden Av N
Seattle, WA 98103
(206) 252-6010
Seattle, WA 98103
(206) 252-6010
Grades: PK-5
| 406 students
Rank: #12 - 1412. - 14.
Mcgilvra Elementary School
(Math: 75-79% | Reading: 85-89%)
Rank:
Rank:
10/
Top 5%10
1617 38 Av E
Seattle, WA 98112
(206) 252-3160
Seattle, WA 98112
(206) 252-3160
Grades: K-5
| 223 students
Rank: #12 - 1412. - 14.
Montlake Elementary School
(Math: 75-79% | Reading: 85-89%)
Rank:
Rank:
10/
Top 5%10
2409 22 Av E
Seattle, WA 98112
(206) 252-3300
Seattle, WA 98112
(206) 252-3300
Grades: K-5
| 184 students
Rank: #1515.
Bryant Elementary School
(Math: 79% | Reading: 83%)
Rank:
Rank:
10/
Top 10%10
3311 Ne 60 St
Seattle, WA 98115
(206) 252-5200
Seattle, WA 98115
(206) 252-5200
Grades: K-5
| 449 students
Rank: #1616.
John Stanford International School
(Math: 83% | Reading: 81%)
Rank:
Rank:
10/
Top 10%10
4057 5 Av Ne
Seattle, WA 98105
(206) 252-6080
Seattle, WA 98105
(206) 252-6080
Grades: K-5
| 443 students
Rank: #1717.
Genesee Hill Elementary School
(Math: 78% | Reading: 83%)
Rank:
Rank:
10/
Top 10%10
5013 Sw Dakota Street
Seattle, WA 98116
(206) 252-9700
Seattle, WA 98116
(206) 252-9700
Grades: K-5
| 543 students
Rank: #1818.
John Hay Elementary School
(Math: 74% | Reading: 85%)
Rank:
Rank:
10/
Top 10%10
201 Garfield St
Seattle, WA 98109
(206) 252-2100
Seattle, WA 98109
(206) 252-2100
Grades: K-5
| 305 students
Rank: #19 - 2019. - 20.
Loyal Heights Elementary School
(Math: 75-79% | Reading: 80-84%)
Rank:
Rank:
10/
Top 10%10
520 Ne Ravenna Blvd
Seattle, WA 98115
(206) 252-1500
Seattle, WA 98115
(206) 252-1500
Grades: K-5
| 476 students
Rank: #19 - 2019. - 20.
North Beach Elementary School
(Math: 75-79% | Reading: 80-84%)
Rank:
Rank:
10/
Top 10%10
9018 24 Av Nw
Seattle, WA 98117
(206) 252-1510
Seattle, WA 98117
(206) 252-1510
Grades: PK-5
| 357 students
Rank: #2121.
Thornton Creek Elementary School
Alternative School
(Math: 75% | Reading: 84%)
Rank:
Rank:
10/
Top 10%10
7712 40th Ave Ne
Seattle, WA 98115
(206) 252-5300
Seattle, WA 98115
(206) 252-5300
Grades: PK-5
| 477 students
Rank: #2222.
Catharine Blaine K-8 School
(Math: 77% | Reading: 81%)
Rank:
Rank:
10/
Top 10%10
2550 34 Av W
Seattle, WA 98199
(206) 252-1920
Seattle, WA 98199
(206) 252-1920
Grades: K-8
| 466 students
Rank: #23 - 2423. - 24.
Eckstein Middle School
(Math: 74% | Reading: 82%)
Rank:
Rank:
10/
Top 10%10
3003 Ne 75 St
Seattle, WA 98115
(206) 252-5010
Seattle, WA 98115
(206) 252-5010
Grades: 6-8
| 1,053 students
Rank: #23 - 2423. - 24.
Whitman Middle School
(Math: 74% | Reading: 82%)
Rank:
Rank:
10/
Top 10%10
9201 15 Av Nw
Seattle, WA 98117
(206) 252-1200
Seattle, WA 98117
(206) 252-1200
Grades: 1-8
| 671 students
Rank: #25 - 2625. - 26.
Hazel Wolf K-8
(Math: 72% | Reading: 82%)
Rank:
Rank:
10/
Top 10%10
11530 12th Ave. Ne
Seattle, WA 98125
(206) 252-4500
Seattle, WA 98125
(206) 252-4500
Grades: K-8
| 707 students
Rank: #25 - 2625. - 26.
Queen Anne Elementary School
(Math: 70-74% | Reading: 80-84%)
Rank:
Rank:
10/
Top 10%10
411 Boston St.
Seattle, WA 98109
(206) 252-2480
Seattle, WA 98109
(206) 252-2480
Grades: K-5
| 480 students
Rank: #2727.
Daniel Bagley Elementary School
(Math: 75-79% | Reading: 75-79%)
Rank:
Rank:
10/
Top 10%10
7821 Stone Av N
Seattle, WA 98103
(206) 252-5110
Seattle, WA 98103
(206) 252-5110
Grades: K-5
| 322 students
Rank: #2828.
Adams Elementary School
(Math: 70% | Reading: 82%)
Rank:
Rank:
10/
Top 10%10
6110 28 Av Nw
Seattle, WA 98107
(206) 252-1300
Seattle, WA 98107
(206) 252-1300
Grades: K-5
| 359 students
Rank: #2929.
Madison Middle School
(Math: 72% | Reading: 80%)
Rank:
Rank:
10/
Top 10%10
3429 45th Ave Sw
Seattle, WA 98116
(206) 252-9200
Seattle, WA 98116
(206) 252-9200
Grades: 6-8
| 967 students
Rank: #3030.
Thurgood Marshall Elementary School
(Math: 76% | Reading: 77%)
Rank:
Rank:
10/
Top 10%10
2401 S Irving St
Seattle, WA 98144
(206) 252-2800
Seattle, WA 98144
(206) 252-2800
Grades: PK-5
| 433 students
Rank: #3131.
Mcclure Middle School
(Math: 71% | Reading: 81%)
Rank:
Rank:
10/
Top 10%10
1915 1 Av W
Seattle, WA 98119
(206) 252-1900
Seattle, WA 98119
(206) 252-1900
Grades: 6-8
| 437 students
Rank: #3232.
Laurelhurst Elementary School
(Math: 70-74% | Reading: 75-79%)
Rank:
Rank:
9/
Top 20%10
4530 46 Av Ne
Seattle, WA 98105
(206) 252-5400
Seattle, WA 98105
(206) 252-5400
Grades: K-5
| 242 students
Rank: #3333.
Cedar Park Elementary School
(Math: 60-79% | Reading: ≥80%)
Rank:
Rank:
9/
Top 20%10
13224 37th Ave Ne
Seattle, WA 98125
(206) 252-4300
Seattle, WA 98125
(206) 252-4300
Grades: PK-5
| 223 students
Rank: #3434.
Salmon Bay K-8 School
Alternative School
(Math: 71% | Reading: 77%)
Rank:
Rank:
9/
Top 20%10
1810 Nw 65 St
Seattle, WA 98117
(206) 252-1720
Seattle, WA 98117
(206) 252-1720
Grades: K-8
| 664 students
Rank: #3535.
Pathfinder K-8 School
Alternative School
(Math: 68% | Reading: 77%)
Rank:
Rank:
9/
Top 20%10
1901 Sw Genesee St
Seattle, WA 98106
(206) 252-9710
Seattle, WA 98106
(206) 252-9710
Grades: K-8
| 468 students
Show 57 more public schools in Seattle School District No. 1 (out of 92 total schools)
Loading...
Recent Articles

How “Collaborative Reasoning” Could Be the Next Public School Trend
Collaborative reasoning, which encourages independent critical thinking, is growing in popularity amongst public schools. Learn about collaborative reasoning and how it benefits public school classrooms.

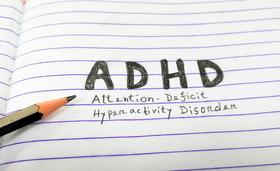
Understanding ADHD in Children: Signs, Diagnosis, and Support Strategies
This comprehensive article explores the complex nature of attention-deficit/hyperactivity disorder (ADHD) in children, providing insights into its symptoms, diagnosis process, and effective support strategies. From recognizing early signs to navigating the diagnostic journey, parents will gain valuable knowledge to help their child thrive. Expert insights, real-life examples, and practical tips empower readers to create a supportive environment that meets the unique needs of children with ADHD.

March 04, 2024
Teaching in Contemporary TimesWe explore why individuals choose teaching, illuminating intrinsic motivations, the influence of role models, the pursuit of lifelong learning, and the aspiration to impact society.


