Hillside Elementary School vs. Table Rock Elementary School
Should you attend Hillside Elementary School or Table Rock Elementary School? Visitors to our site frequently compare these two schools. Compare their rankings, test scores, reviews and more to help you determine which school is the best choice for you.
School Overview
School
Top Rankings
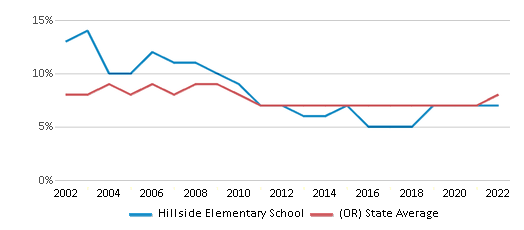
Hillside Elementary School ranks among the top 20% of public schools in Oregon for:
Category
Attribute
Percent Eligible For Free Lunch
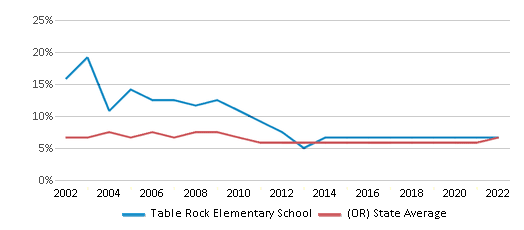
Table Rock Elementary School ranks among the top 20% of public schools in Oregon for:
Category
Attribute
Percent Eligible For Free Lunch
Overview
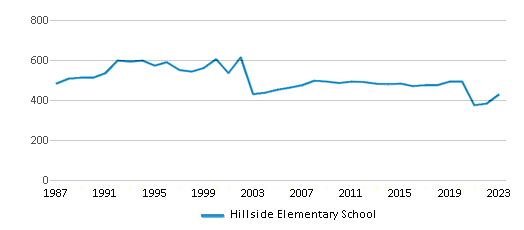
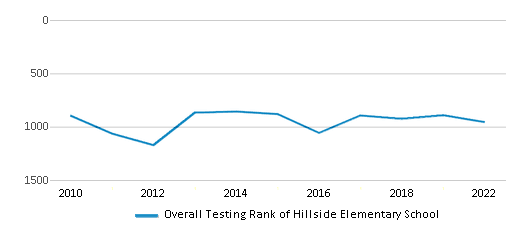
Serving 435 students in grades Kindergarten-5, Hillside Elementary School ranks in the bottom 50% of all schools in Oregon for overall test scores (math proficiency is bottom 50%, and reading proficiency is bottom 50%).
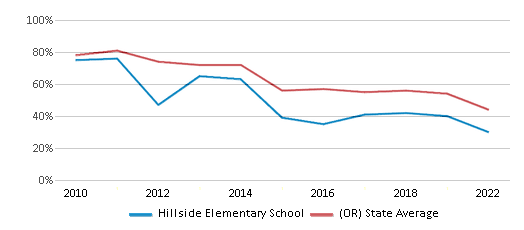
The percentage of students achieving proficiency in math is 23% (which is lower than the Oregon state average of 31%). The percentage of students achieving proficiency in reading/language arts is 30% (which is lower than the Oregon state average of 44%).
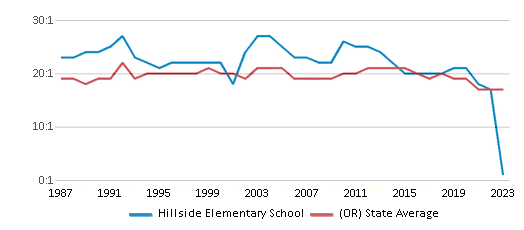
The student-teacher ratio of 15:1 is lower than the Oregon state level of 17:1.
Minority enrollment is 25% of the student body (majority Hispanic), which is lower than the Oregon state average of 42% (majority Hispanic).
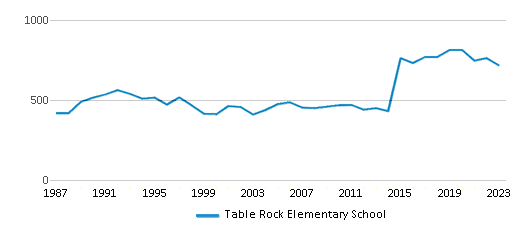
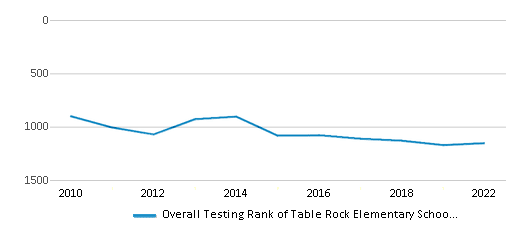
Serving 705 students in grades Kindergarten-5, Table Rock Elementary School ranks in the bottom 50% of all schools in Oregon for overall test scores (math proficiency is bottom 50%, and reading proficiency is bottom 50%).
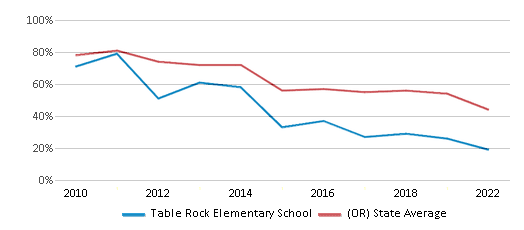
The percentage of students achieving proficiency in math is 12% (which is lower than the Oregon state average of 31%). The percentage of students achieving proficiency in reading/language arts is 19% (which is lower than the Oregon state average of 44%).
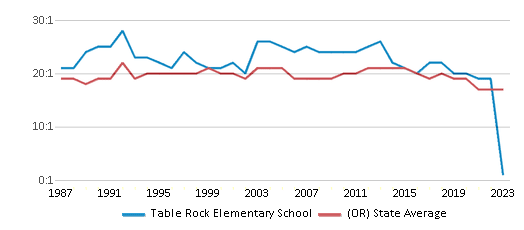
The student-teacher ratio of 15:1 is lower than the Oregon state level of 17:1.
Minority enrollment is 59% of the student body (majority Hispanic), which is higher than the Oregon state average of 42% (majority Hispanic).
Grades Offered
K-5
K-5
Total Students
435 students
705 students
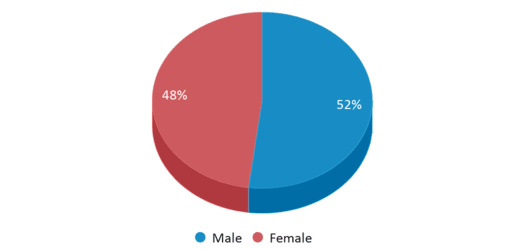
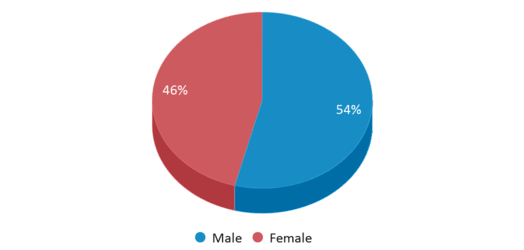
% Male | % Female
52% | 48%
54% | 46%
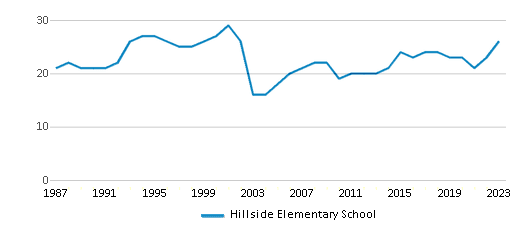
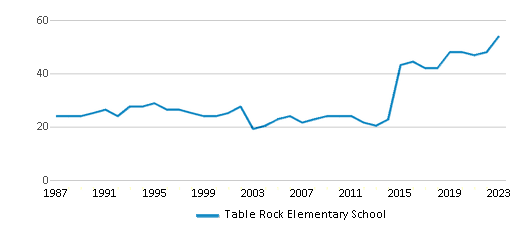
Total Classroom Teachers
29 teachers
48 teachers
Student-Teacher Ratio
15:1
15:1
Test Scores
Overall Testing Rank
#891 out of 1174 schools in OR
(Bottom 50%)
(Bottom 50%)
#1114 out of 1174 schools in OR
(Bottom 50%)
(Bottom 50%)
Math Test Scores (% Proficient)
23%
12%
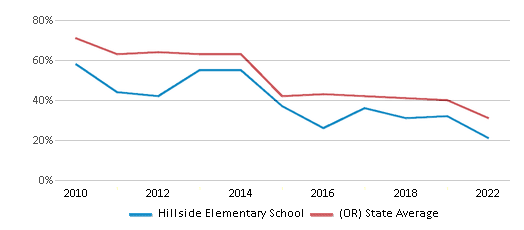
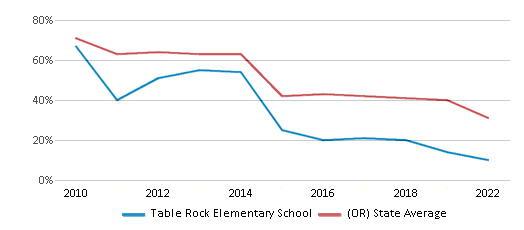
Reading/Language Arts Test Scores (% Proficient)
30%
19%
Science Test Scores (% Proficient)
15-19%
10-14%
Students by Grade
Students by Grade
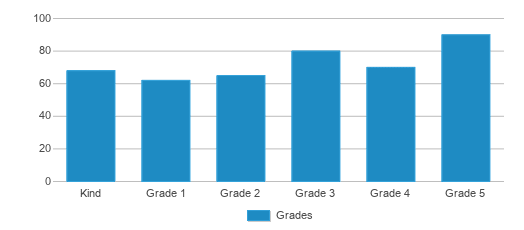
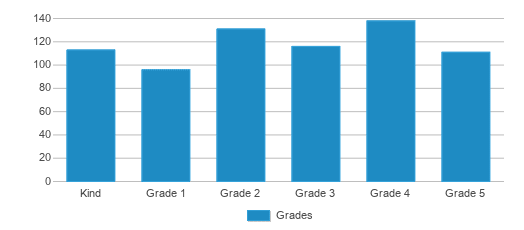
Kindergarten Students
68
113
Grade 1 Students
62
96
Grade 2 Students
65
131
Grade 3 Students
80
116
Grade 4 Students
70
138
Grade 5 Students
90
111
Students by Ethnicity
% American Indian
1%
1%
% Asian
n/a
n/a
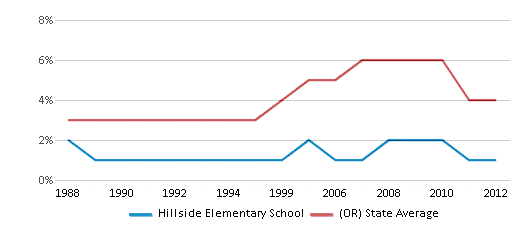
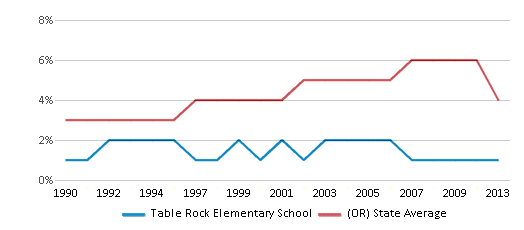
% Hispanic
19%
51%
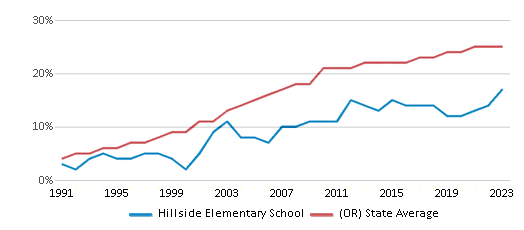
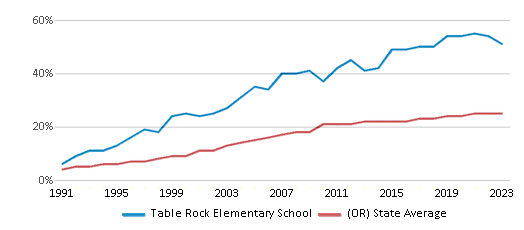
% Black
n/a
n/a
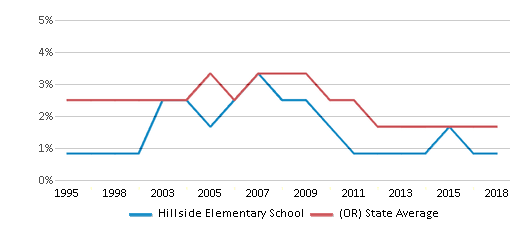
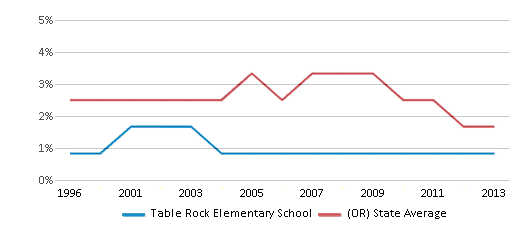
% White
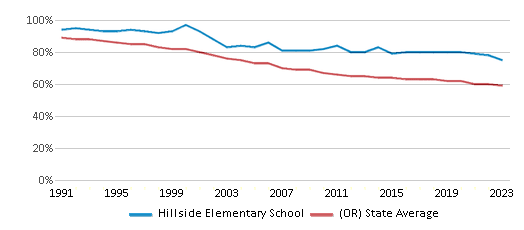
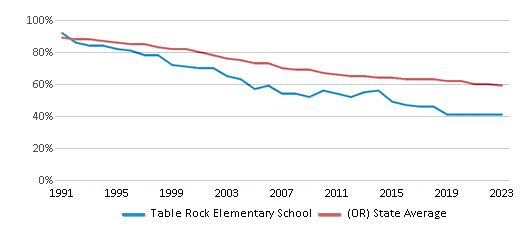
75%
41%
% Hawaiian
n/a
1%
n/a
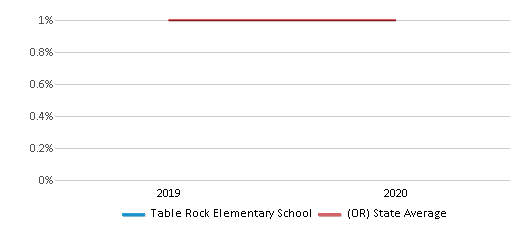
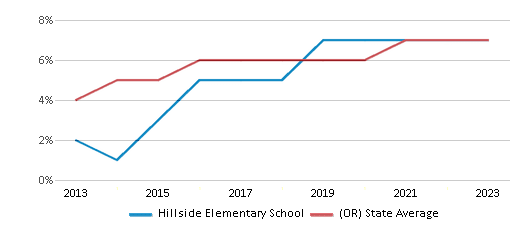
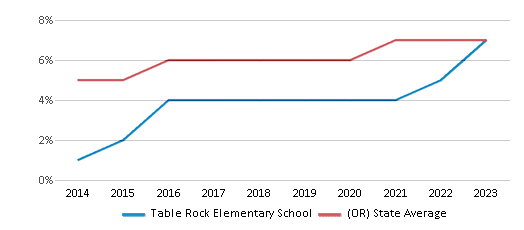
% Two or more races
5%
6%
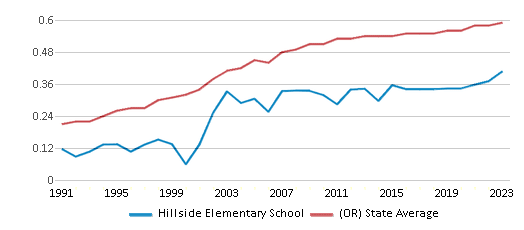
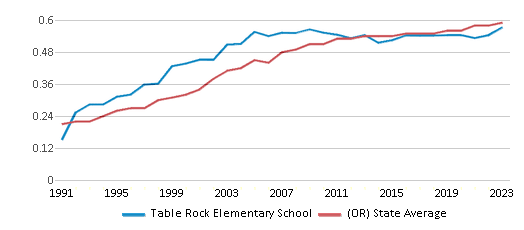
Diversity Score
0.40
0.57
Additional Information
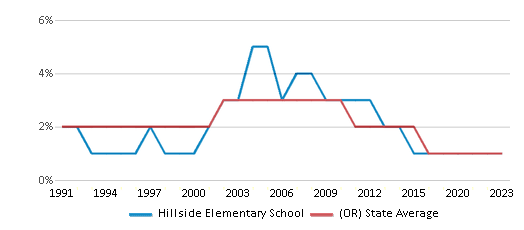
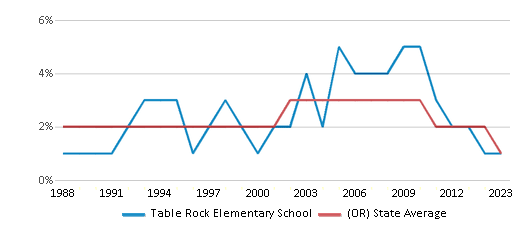
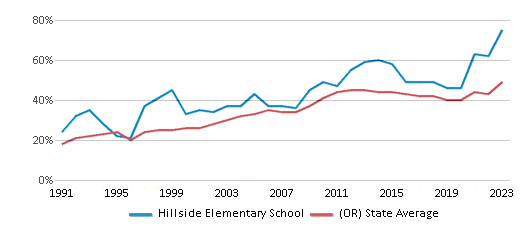
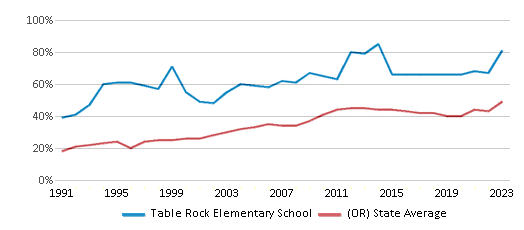
Eligible for Free Lunch
76%
80%
Eligible for Reduced Lunch
7%
8%
