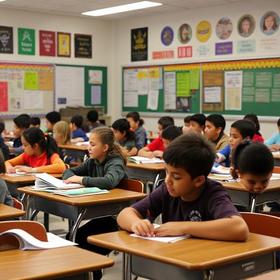
For the 2025-26 school year, there is 1 public preschool serving 212 students in Waverly Community Unit School District 6. This district's average pre testing ranking is 3/10, which is in the bottom 50% of public pre schools in Illinois.
Public Preschool in Waverly Community Unit School District 6 have an average math proficiency score of 12% (versus the Illinois public pre school average of 23%), and reading proficiency score of 22% (versus the 25% statewide average).
Minority enrollment is 11% of the student body (majority Black), which is less than the Illinois public preschool average of 58% (majority Hispanic).
Overview
This School District
This State (IL)
# Schools
2 Schools
1,387 Schools
# Students
350 Students
512,005 Students
# Teachers
26 Teachers
38,167 Teachers
Student-Teacher Ratio
13:1
13:1
Student By Grade
District Rank
Waverly Community Unit School District 6, which is ranked within the bottom 50% of all 864 school districts in Illinois (based off of combined math and reading proficiency testing data) for the 2022-2023 school year.
The school district's graduation rate of 80% has stayed relatively flat over five school years.
Overall District Rank
#653 out of 865 school districts
(Bottom 50%)
(Bottom 50%)
Math Test Scores (% Proficient)
14%
27%
Reading/Language Arts Test Scores (% Proficient)
20-24%
30%
Science Test Scores (% Proficient)
60-69%
50%
Graduation Rate
(21-22)≥80%
87%
Students by Ethnicity:
Diversity Score
0.19
0.70
% American Indian
n/a
n/a
% Asian
1%
4%
% Hispanic
1%
32%
% Black
3%
18%
% White
90%
42%
% Hawaiian
n/a
n/a
% Two or more races
5%
4%
All Ethnic Groups
District Revenue and Spending
The revenue/student of $17,194 in this school district is less than the state median of $22,423. The school district revenue/student has stayed relatively flat over four school years.
The school district's spending/student of $17,091 is less than the state median of $21,662. The school district spending/student has stayed relatively flat over four school years.
Total Revenue
$6 MM
$41,381 MM
Spending
$6 MM
$39,976 MM
Revenue / Student
$17,194
$22,423
Spending / Student
$17,091
$21,662
Best Waverly Community Unit School District 6 Public Preschools (2025-26)
School
(Math and Reading Proficiency)
(Math and Reading Proficiency)
Location
Quick Facts
Rank: #11.
Waverly Elementary School
(Math: 10-14% | Reading: 20-24%)
Rank:
Rank:
4/
Bottom 50%10
499 W Elm St
Waverly, IL 62692
(217) 435-2331
Waverly, IL 62692
(217) 435-2331
Gr: PK-6 | 212 students Student-teacher ratio: 12:1 Minority enrollment: 11%
Recent Articles

How Public Schools Support Students on Free / Reduced-Lunch Programs
Explore how U.S. public schools support students eligible for free or reduced-price lunch through nutrition, academic, and wraparound services in 2025.

Hidden Costs of Public Schools: Fees, Supplies & Extras
Explore the hidden costs in public schools—fees, supplies, extracurriculars—and how parents can plan for them in 2025.

Public School Funding 2025: What Families Should Know
Essential insights on public school funding in 2025—how it works, what’s changing, and what families should know to stay ahead.


