Forney High School is a public secondary school located in Forney, Texas, United States. It is one of two high schools in the Forney Independent School District which serves Forney, Talty, the small Kaufman County portion of Mesquite, and some surrounding unincorporated areas of Kaufman County.
Serving 2,582 students in grades 9-12, Forney High School ranks in the top 30% of all schools in Texas for overall test scores (math proficiency is top 30%, and reading proficiency is top 30%).
The percentage of students achieving proficiency in math is 53% (which is higher than the Texas state average of 44%). The percentage of students achieving proficiency in reading/language arts is 56% (which is higher than the Texas state average of 51%).
The student-teacher ratio of 16:1 is higher than the Texas state level of 14:1.
Minority enrollment is 64% of the student body (majority Hispanic and Black), which is lower than the Texas state average of 76% (majority Hispanic).
Quick Facts (2026)
- Grades: 9-12
- Enrollment: 2,582 students
- Student-Teacher Ratio: 16:1
- Minority Enrollment: 64%
- Graduation Rate: 93% (Top 50% in TX)
- Overall Testing Rank: Top 30%
- Math Proficiency: 53% (Top 30%)
- Reading Proficiency: 56% (Top 50%)
- Science Proficiency: 57% (Top 20%)
- Source: National Center for Education Statistics (NCES), TX Dept. of Education
Top Rankings
Forney High School ranks among the top 20% of public schools in Texas for:
Category
Attribute
Science Proficiency
School Overview
Forney High School's student population of 2,582 students has grown by 47% over five school years.
The teacher population of 157 teachers has grown by 55% over five school years.
Grades Offered
Grades 9-12
Total Students
2,582 students
Total Classroom Teachers
157 teachers
School Calendar
School Rankings
Forney High School ranks within the top 30% of all 8,096 schools in Texas (based off of combined math and reading proficiency testing data).
The diversity score of Forney High School is 0.71, which is more than the diversity score at state average of 0.64. The school's diversity has stayed relatively flat over five school years.
Overall Testing Rank
#2315 out of 8096 schools
(Top 30%)
(Top 30%)
Math Test Scores (% Proficient)
53%
44%
Reading/Language Arts Test Scores (% Proficient)
56%
51%
Science Test Scores (% Proficient)
57%
46%
Student-Teacher Ratio
16:1
14:1
American Indian
n/a
n/a
Asian
2%
6%
Hispanic
30%
54%
Black
28%
13%
White
36%
24%
Hawaiian
n/a
n/a
Two or more races
4%
3%
All Ethnic Groups
Graduation Rate
93%
90%
Chronically Absent Students
(22-23)19.7%
23%
Participates in the National School Lunch Program (NSLP)
Yes
Eligible for Free Lunch
24%
56%
Eligible for Reduced Lunch
5%
4%
School Statewide Testing
School District Name
Source: National Center for Education Statistics (NCES), TX Dept. of Education
Frequently Asked Questions
What is Forney High School's ranking?
Forney High School is ranked #2315 out of 8,096 schools, which ranks it among the top 30% of public schools in Texas.
What schools are Forney High School often compared to?
Forney High Schoolis often viewed alongside schools like North Forney High School by visitors of our site.
What percent of students have achieved state testing proficiency in math and reading?
53% of students have achieved math proficiency (compared to the 44% TX state average), while 56% of students have achieved reading proficiency (compared to the 51% TX state average).
What is the graduation rate of Forney High School?
The graduation rate of Forney High School is 93%, which is higher than the Texas state average of 90%.
How many students attend Forney High School?
2,582 students attend Forney High School.
What is the racial composition of the student body?
36% of Forney High School students are White, 30% of students are Hispanic, 28% of students are Black, 4% of students are Two or more races, and 2% of students are Asian.
What is the student-teacher ratio of Forney High School?
Forney High School has a student ration of 16:1, which is higher than the Texas state average of 14:1.
What grades does Forney High School offer ?
Forney High School offers enrollment in grades 9-12
What school district is Forney High School part of?
Forney High School is part of Forney Independent School District.
School Reviews
Review Forney High School. Reviews should be a few sentences in length. Please include any comments on:
- Quality of academic programs, teachers, and facilities
- Availability of music, art, sports and other extracurricular activities
Recent Articles

Phone Bans Are Expanding: Will They Actually Help Your Child?
Phone bans are spreading in public schools nationwide. Learn how to evaluate whether a school's cellphone policy will improve your child's learning and well-being.

Should You Move for a Better Public School or Stay Put?
Considering a move to a higher-rated public school? Learn how to weigh school quality, housing costs, and family priorities before relocating.

How to Compare Public School Value Beyond Test Scores
Learn how to evaluate public school value using student support, school climate, opportunities, and outcomes, not just standardized test scores.

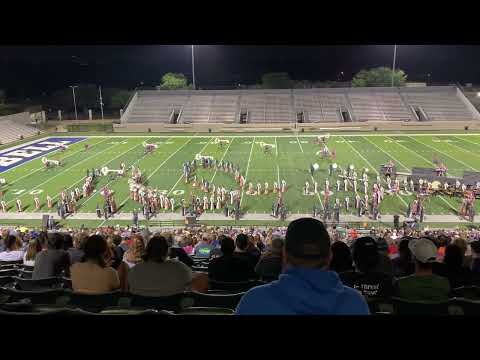
 performing their show, “Edgar Allan Poe’s, The Raven”, at the Coppell High School (Coppell, TX) championship contest on 4-3-22.
Forney HS Winter Guard competed in the NTCA winter guard circuit in North Texas under the National A division.
Color Guard Director: Casey Snead")


")


