For the 2025-26 school year, there is 1 public high school serving 304 students in Mayville Community School District. This district's average high testing ranking is 5/10, which is in the bottom 50% of public high schools in Michigan.
Public High School in Mayville Community School District have an average math proficiency score of 27% (versus the Michigan public high school average of 30%), and reading proficiency score of 37% (versus the 48% statewide average).
Public High School in Mayville Community School District have a Graduation Rate of 75%, which is less than the Michigan average of 82%.
The school with highest graduation rate is Mayville Middle High School, with 70-79% graduation rate. Read more about public school graduation rate statistics in Michigan or national school graduation rate statistics.
Minority enrollment is 10% of the student body (majority Hispanic), which is less than the Michigan public high school average of 36% (majority Black).
Overview
This School District
This State (MI)
# Schools
2 Schools
1,341 Schools
# Students
558 Students
534,562 Students
# Teachers
32 Teachers
30,578 Teachers
Student-Teacher Ratio
17:1
17:1
Student By Grade
District Rank
Mayville Community School District, which is ranked within the bottom 50% of all 845 school districts in Michigan (based off of combined math and reading proficiency testing data) for the 2022-2023 school year.
The school district's graduation rate of 75% has increased from 60-69% over five school years.
Overall District Rank
#426 out of 862 school districts
(Top 50%)
(Top 50%)
Math Test Scores (% Proficient)
36%
35%
Reading/Language Arts Test Scores (% Proficient)
34%
45%
Science Test Scores (% Proficient)
25-29%
38%
Graduation Rate
75%
81%
Students by Ethnicity:
Diversity Score
0.15
0.55
% American Indian
1%
1%
% Asian
n/a
4%
% Hispanic
4%
9%
% Black
1%
17%
% White
92%
64%
% Hawaiian
n/a
n/a
% Two or more races
2%
5%
All Ethnic Groups
District Revenue and Spending
The revenue/student of $14,676 in this school district is less than the state median of $18,512. The school district revenue/student has stayed relatively flat over four school years.
The school district's spending/student of $12,278 is less than the state median of $17,694. The school district spending/student has stayed relatively flat over four school years.
Total Revenue
$8 MM
$25,476 MM
Spending
$7 MM
$24,351 MM
Revenue / Student
$14,676
$18,512
Spending / Student
$12,278
$17,694
Best Mayville Community School District Public High Schools (2025-26)
School
(Math and Reading Proficiency)
(Math and Reading Proficiency)
Location
Quick Facts
Rank: #11.
Mayville Middle High School
(Math: 25-29% | Reading: 35-39%)
Rank:
Rank:
4/
Bottom 50%10
6250 Fulton St
Mayville, MI 48744
(989) 843-6115
Mayville, MI 48744
(989) 843-6115
Gr: 6-12 | 304 students Student-teacher ratio: 18:1 Minority enrollment: 10%
Recent Articles

Public School Open House & Enrollment Season Guide for Parents
Learn what to ask at a public school open house during enrollment season, from academics to safety, to choose the right school for your child.

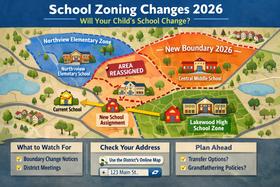
School Zoning Changes 2026: How Assignments May Shift
School Zoning Changes 2026 could affect your child’s school assignment. Learn how zoning works, what is changing, and how families can prepare.

School Vouchers: Updated Pros and Cons (2025 Review)
Comprehensive 2025 analysis of school vouchers, weighing benefits and challenges for families, funding, outcomes, and policy directions.


