Top Rankings
Northland Preparatory And Fitness Academy School District ranks among the top 20% of public school district in Ohio for:
Category
Attribute
Student Attention
Lowest student:teacher ratio (Top 1%)
For the 2025 school year, there is 1 public elementary school serving 161 students in Northland Preparatory And Fitness Academy School District. This district's average elementary testing ranking is 2/10, which is in the bottom 50% of public elementary schools in Ohio.
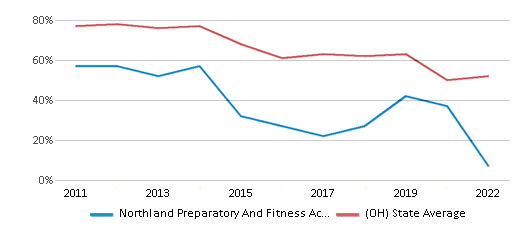
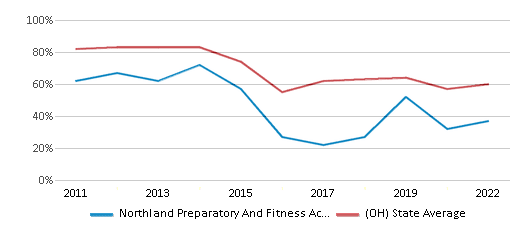
Public Elementary School in Northland Preparatory And Fitness Academy School District have an average math proficiency score of 8% (versus the Ohio public elementary school average of 54%), and reading proficiency score of 37% (versus the 59% statewide average).
Minority enrollment is 98% of the student body (majority Black), which is more than the Ohio public elementary school average of 35% (majority Black).
Overview
This School District
This State (OH)
# Schools
1 School
2,458 Schools
# Students
161 Students
1,091,015 Students
# Teachers
19 Teachers
63,050 Teachers
Student : Teacher Ratio
8:1
8:1
District Rank
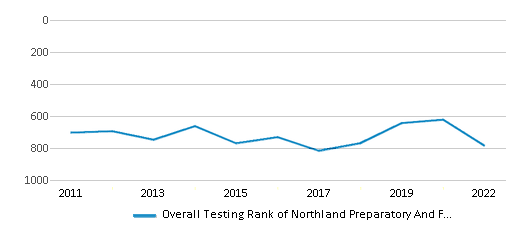
Northland Preparatory And Fitness Academy School District, which is ranked within the bottom 50% of all 918 school districts in Ohio (based off of combined math and reading proficiency testing data) for the 2021-2022 school year.
Overall District Rank
#785 out of 929 school districts
(Bottom 50%)
(Bottom 50%)
Math Test Scores (% Proficient)
6-9%
52%
Reading/Language Arts Test Scores (% Proficient)
35-39%
60%
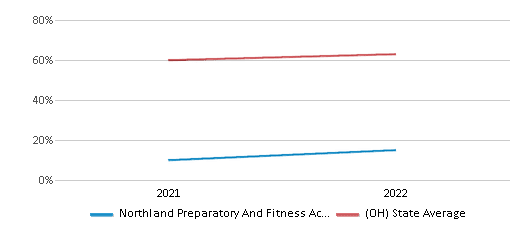
Science Test Scores (% Proficient)
11-19%
63%
Students by Ethnicity:
Diversity Score
0.36
0.55
# American Indian Students
n/a
1,574 Students
% American Indian Students
n/a
n/a
# Asian Students
n/a
32,328 Students
% Asian Students
n/a
3%
# Hispanic Students
18 Students
86,617 Students
% Hispanic Students
11%
8%
# Black Students
127 Students
192,244 Students
% Black Students
79%
18%
# White Students
3 Students
704,631 Students
% White Students
2%
64%
# Hawaiian Students
1 Student
1,092 Students
% Hawaiian Students
1%
n/a
# Two or more races Students
12 Students
72,529 Students
% of Two or more races Students
7%
7%
Students by Grade:
# Students in PK Grade:
-
30,887
# Students in K Grade:
21
112,601
# Students in 1st Grade:
25
119,240
# Students in 2nd Grade:
19
123,668
# Students in 3rd Grade:
16
116,979
# Students in 4th Grade:
17
120,578
# Students in 5th Grade:
16
121,564
# Students in 6th Grade:
19
121,429
# Students in 7th Grade:
15
90,010
# Students in 8th Grade:
13
88,363
# Students in 9th Grade:
-
11,363
# Students in 10th Grade:
-
10,664
# Students in 11th Grade:
-
12,317
# Students in 12th Grade:
-
11,352
# Ungraded Students:
-
-
District Revenue and Spending
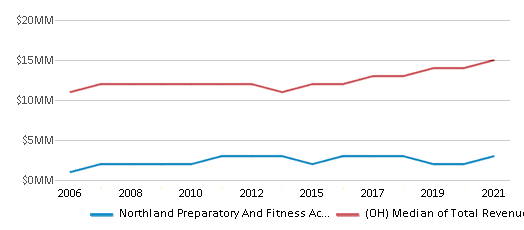
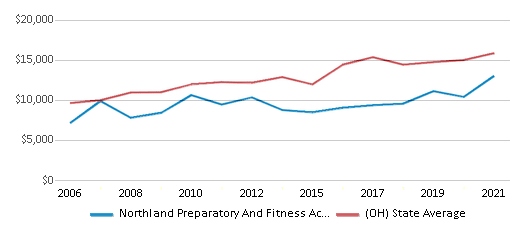
The revenue/student of $18,106 is higher than the state median of $17,287. The school district revenue/student has grown by 39% over four school years.
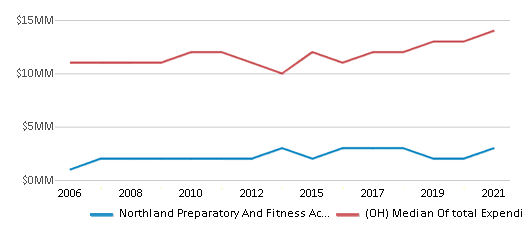
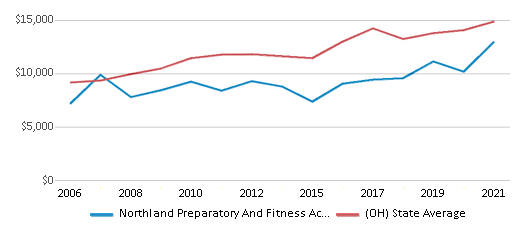
The school district's spending/student of $18,037 is higher than the state median of $17,235. The school district spending/student has grown by 39% over four school years.
Total Revenue
$3 MM
$28,879 MM
Spending
$3 MM
$28,792 MM
Revenue / Student
$18,106
$17,287
Spending / Student
$18,037
$17,235
Best Northland Preparatory And Fitness Academy School District Public Elementary Schools (2025)
School
(Math and Reading Proficiency)
(Math and Reading Proficiency)
Location
Grades
Students
Rank: #11.
Northland Preparatory And Fitness Academy
Charter School
(Math: 6-9% | Reading: 35-39%)
Rank:
Rank:
2/
Bottom 50%10
1875 Morse Rd
Columbus, OH 43229
(614) 318-0600
Columbus, OH 43229
(614) 318-0600
Grades: K-8
| 161 students
Recent Articles

Will Single Sex Classrooms Save Public Schools?
Learn about the benefits of single sex classrooms and why public schools are hoping this type of classroom will save the American school system.

Why Fast Food is “Healthier” Than School Lunches: The Shocking USDA Truth
Your child’s public school lunches may be held to lower quality criteria than even fast food. Learn about the shocking investigations that expose the dangers and risks of public school cafeteria lunches.

When Public Schools Fail Special Education Students: What Parents Can Do
Parents of special education students who are frustrated with the lack of support in the public school system are taking matters into their own hands. Learn about the lawsuits parents are filing against public schools that are failing special ed students.


