


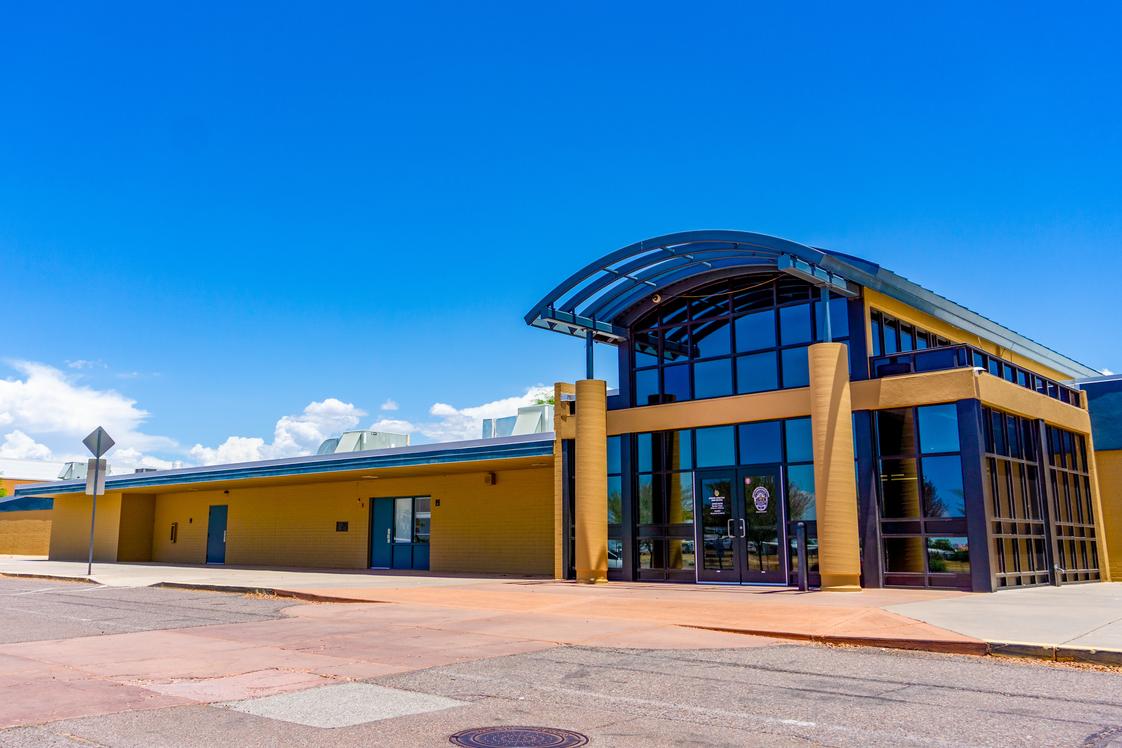
Apache Junction High School is a high school in Apache Junction, Arizona under the jurisdiction of the Apache Junction Unified School District.
Serving 796 students in grades 9-12, Apache Junction High School ranks in the bottom 50% of all schools in Arizona for overall test scores (math proficiency is bottom 50%, and reading proficiency is bottom 50%).
The percentage of students achieving proficiency in math is 15-19% (which is lower than the Arizona state average of 34%). The percentage of students achieving proficiency in reading/language arts is 25% (which is lower than the Arizona state average of 40%).
The student-teacher ratio of 17:1 is equal to the Arizona state level of 17:1.
Minority enrollment is 49% of the student body (majority Hispanic), which is lower than the Arizona state average of 67% (majority Hispanic).
Quick Facts (2026)
- Grades: 9-12
- Enrollment: 796 students
- Student-Teacher Ratio: 17:1
- Minority Enrollment: 49%
- Graduation Rate: 83% (Top 50% in AZ)
- Overall Testing Rank: Bottom 50%
- Math Proficiency: 15-19% (Btm 50%)
- Reading Proficiency: 25% (Btm 50%)
- Science Proficiency: 17% (Btm 50%)
- Source: National Center for Education Statistics (NCES), AZ Dept. of Education
School Overview
Apache Junction High School's student population of 796 students has declined by 10% over five school years.
The teacher population of 46 teachers has stayed relatively flat over five school years.
Grades Offered
Grades 9-12
(No virtual instruction)
(No virtual instruction)
Total Students
796 students
Total Classroom Teachers
46 teachers
Year Founded
1956
School Calendar
School Motto
We Mine Success!
School Rankings
Apache Junction High School ranks within the bottom 50% of all 1,921 schools in Arizona (based off of combined math and reading proficiency testing data).
The diversity score of Apache Junction High School is 0.57, which is less than the diversity score at state average of 0.66. The school's diversity has stayed relatively flat over five school years.
Overall Testing Rank
#1363 out of 1921 schools
(Bottom 50%)
(Bottom 50%)
Math Test Scores (% Proficient)
15-19%
34%
Reading/Language Arts Test Scores (% Proficient)
25%
40%
Science Test Scores (% Proficient)
17%
24%
Student-Teacher Ratio
17:1
17:1
American Indian
1%
5%
Asian
1%
3%
Hispanic
42%
49%
Black
1%
6%
White
51%
33%
Hawaiian
n/a
n/a
Two or more races
4%
4%
All Ethnic Groups
Graduation Rate
83%
77%
Chronically Absent Students
(22-23)79.8%
41.2%
Eligible for Free Lunch
72%
41%
Eligible for Reduced Lunch
13%
10%
School Statewide Testing
School District Name
Sports
Total Sports Offered
14 sports
Sports
BaseballBasketball
CheeringCross Country
FootballGolf
SoccerSoftball
Swimming and DivingTennis
TrackTrack and Field
Volley BallWrestling
Extracurriculars
Total ExtracurricularsTotal Extra-curric.
3 extracurriculars
ExtracurricularsExtra-curric.
Club or Organization:
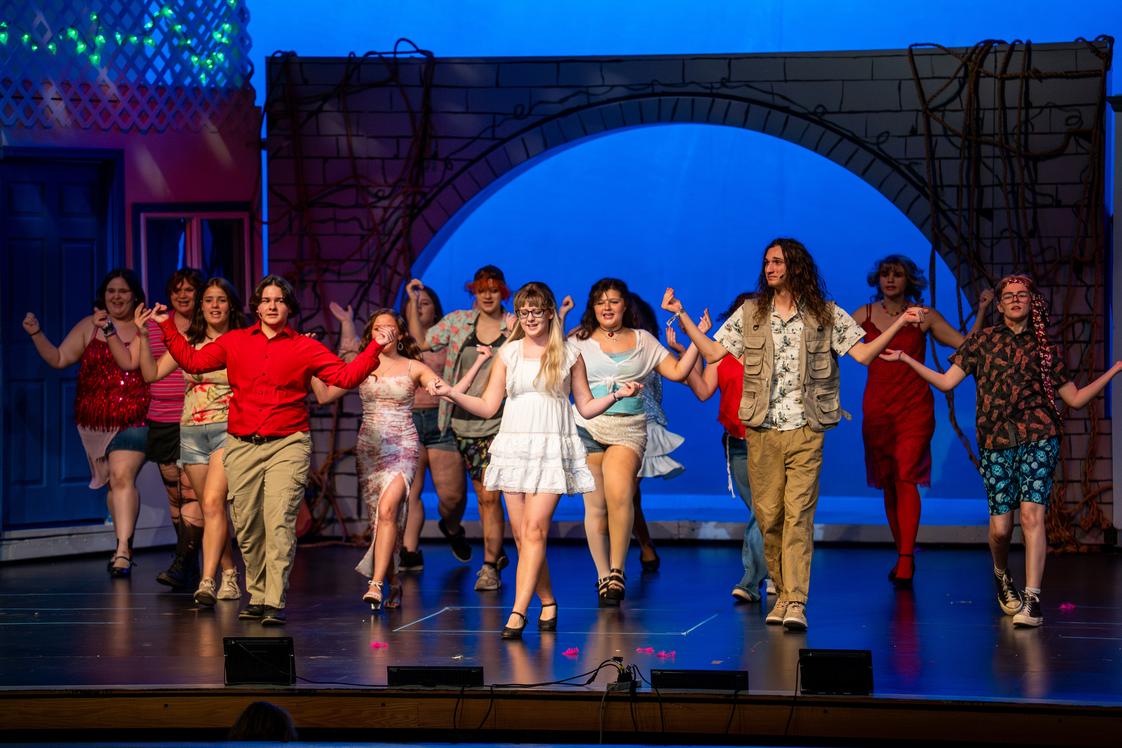
Arts and Music Programs:
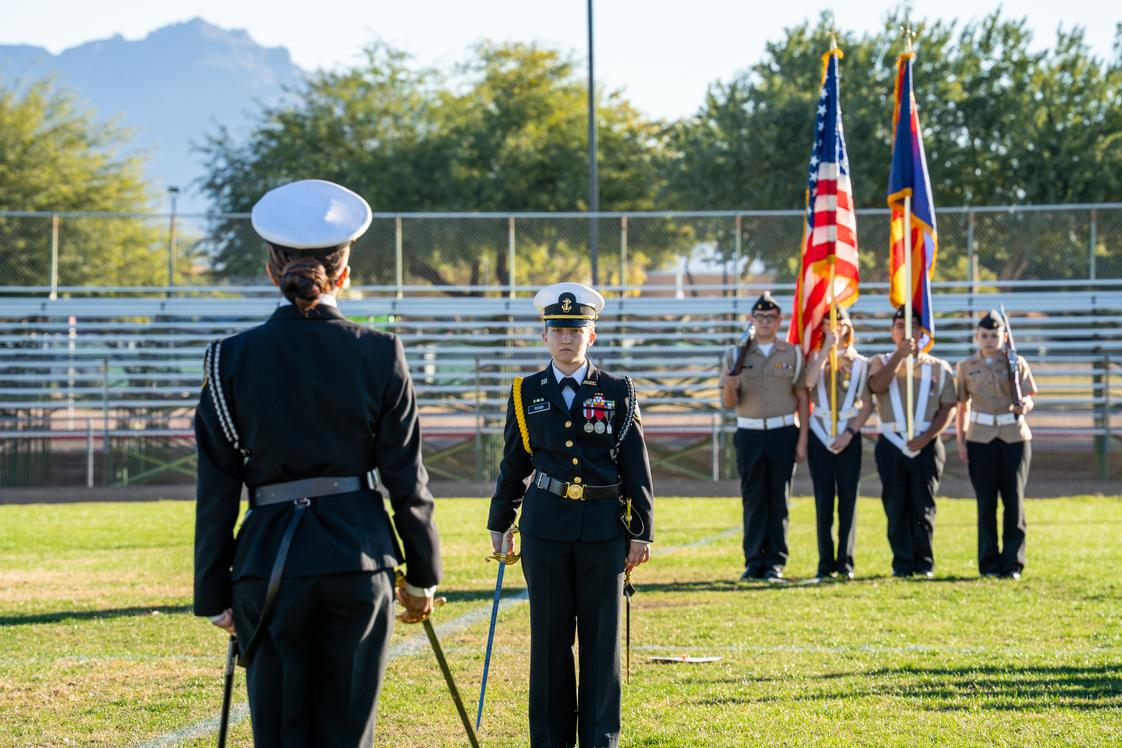
NJROTC
Arts and Music Programs:
ChoirDrama
Source: National Center for Education Statistics (NCES), AZ Dept. of Education
School Notes
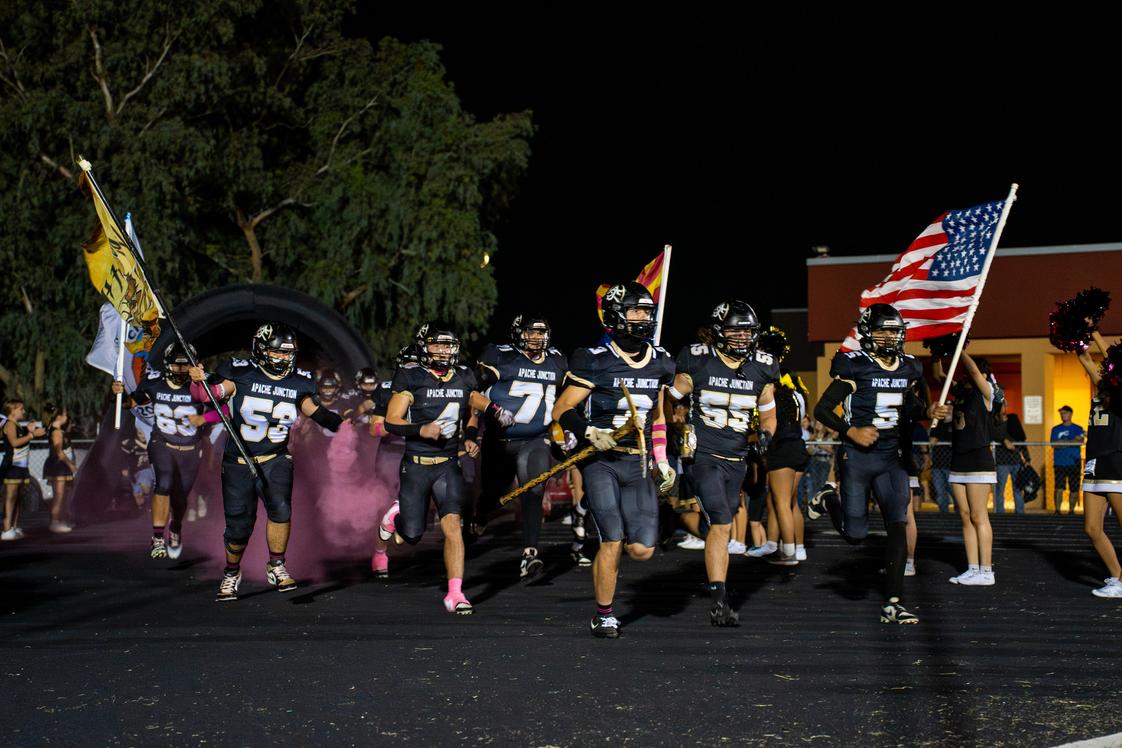
- School Mascot: Prospectors
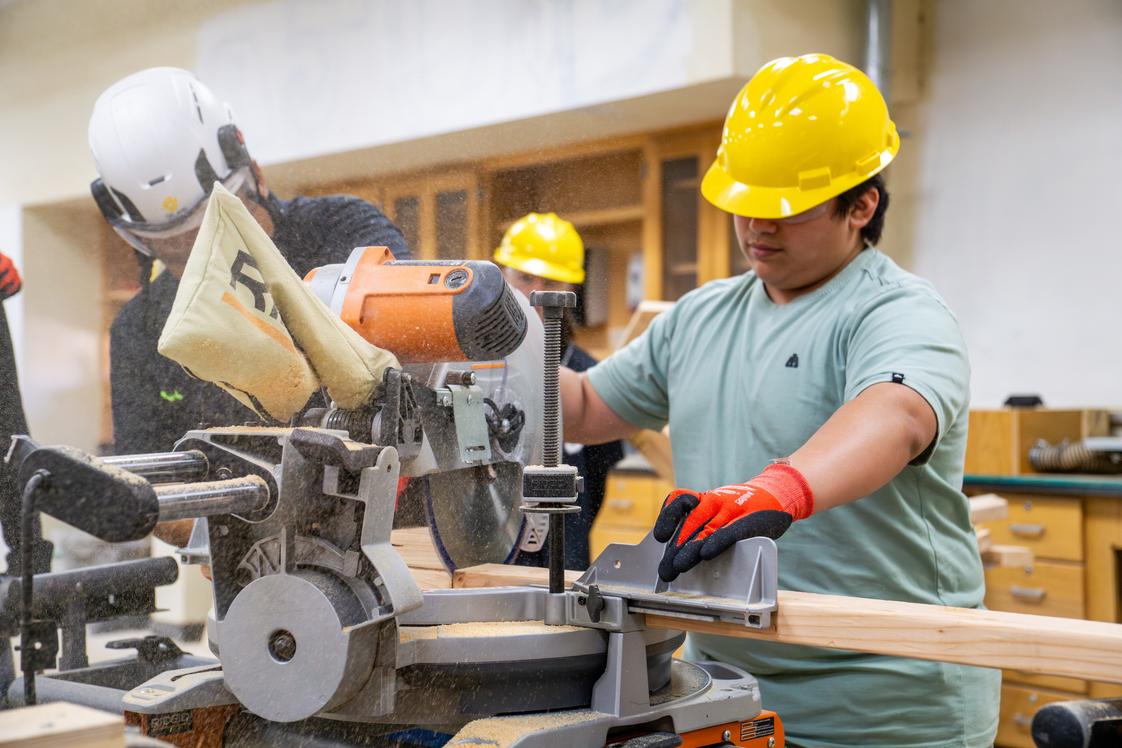
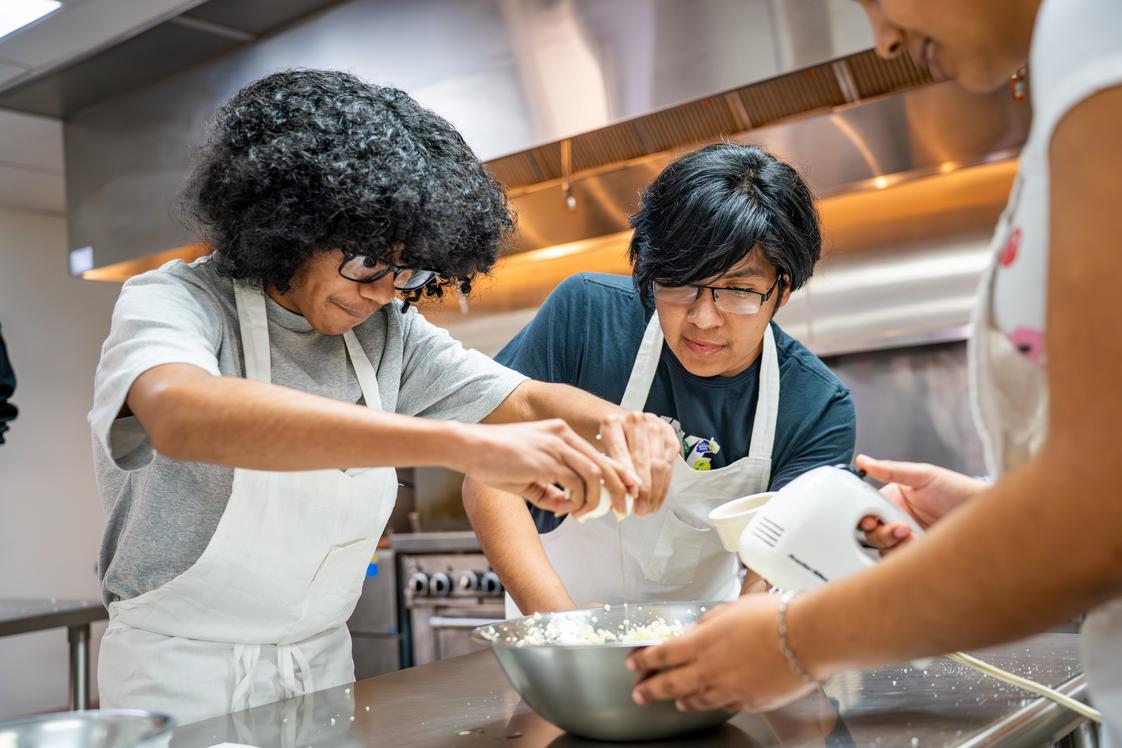
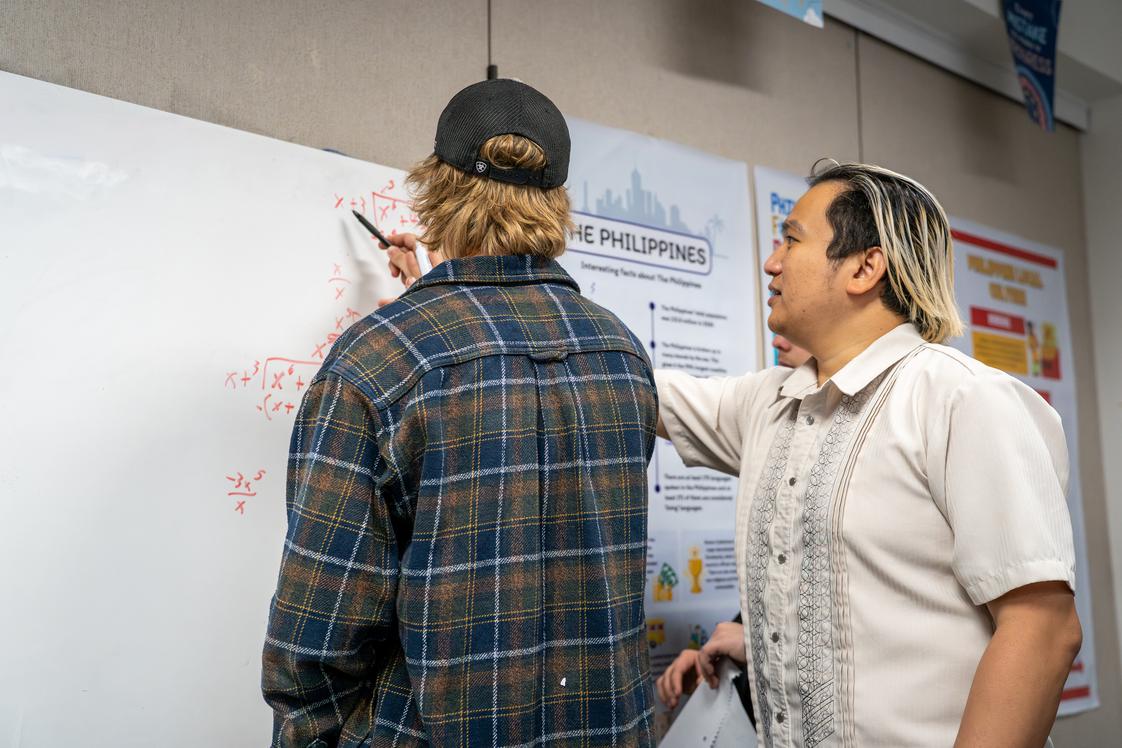
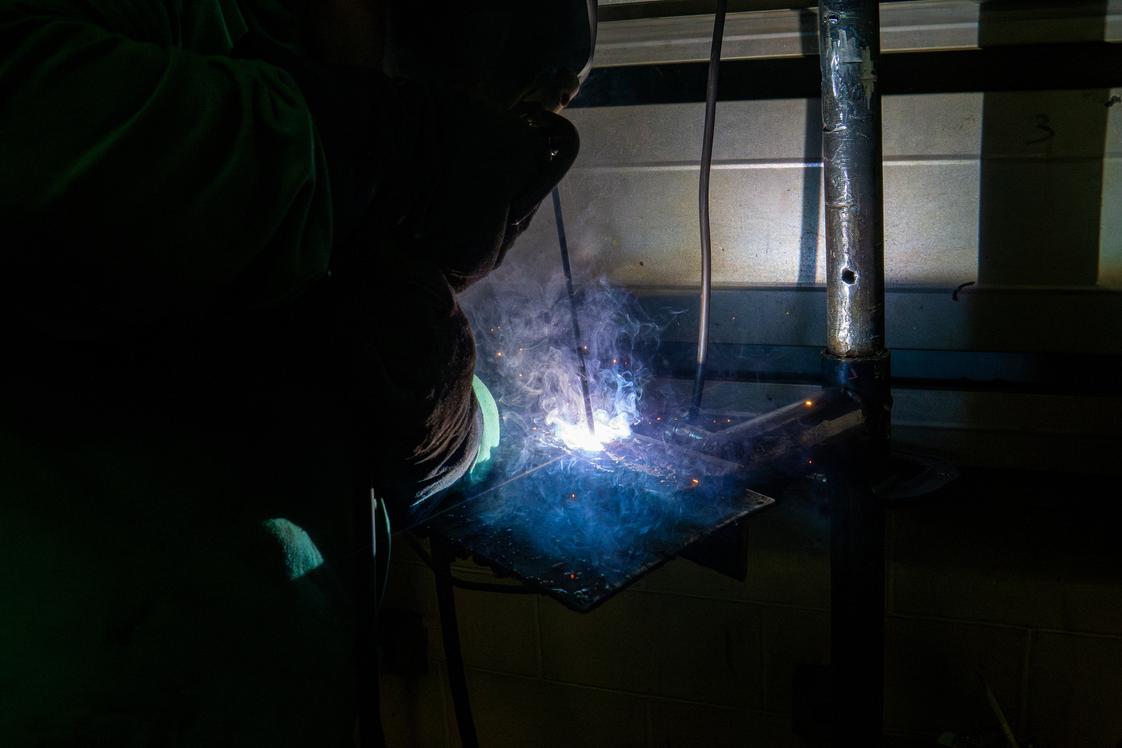
- Apache Junction High School, serving around 900 students in grades 912, is the heart of the Apache Junction Unified School District and a place where students are known, supported, and encouraged to thrive. Rooted in GRIT-Growth, Relationships, Integrity, and Trust-AJHS cultivates confidence, creativity, and respect in every student while honoring a rich tradition and strong alumni support. Career & Technical Education (CTE): AJHS's CTE program provides hands-on, real-world learning that prepares students for both college and careers. Students can explore pathways in construction, culinary arts, graphic design & marketing, and welding, gaining technical skills, leadership experience, and opportunities for industry-recognized certifications. The program emphasizes practical skills, professional growth, and connections to mentors and employers, helping students build resumes and portfolios while discovering career passions. Sports & Athletics: As the home of the Prospectors, AJHS offers a full slate of competitive athletic opportunities across fall, winter, and spring seasons. Student-athletes compete in sports such as basketball, soccer, wrestling, baseball, softball, tennis, and track & field, representing the school in the 3A Central Conference with pride and sportsmanship. These programs foster teamwork, leadership, and school spirit, enriching the high school experience on and off the field. Together with a range of arts, clubs, and academic supports, AJHS helps students find their path, build lasting friendships, and prepare for bright futures beyond high school.
Profile last updated: 12/29/2025
Frequently Asked Questions
What is Apache Junction High School's ranking?
Apache Junction High School is ranked #1363 out of 1,921 schools, which ranks it among the bottom 50% of public schools in Arizona.
What schools are Apache Junction High School often compared to?
Apache Junction High Schoolis often viewed alongside schools like Imagine Prep Superstition, Apache Trail High School by visitors of our site.
What percent of students have achieved state testing proficiency in math and reading?
15-19% of students have achieved math proficiency (compared to the 34% AZ state average), while 25% of students have achieved reading proficiency (compared to the 40% AZ state average).
What is the graduation rate of Apache Junction High School?
The graduation rate of Apache Junction High School is 83%, which is higher than the Arizona state average of 77%.
How many students attend Apache Junction High School?
796 students attend Apache Junction High School.
What is the racial composition of the student body?
51% of Apache Junction High School students are White, 42% of students are Hispanic, 4% of students are Two or more races, 1% of students are American Indian, 1% of students are Asian, and 1% of students are Black.
What is the student-teacher ratio of Apache Junction High School?
Apache Junction High School has a student ration of 17:1, which is equal to the Arizona state average of 17:1.
What grades does Apache Junction High School offer ?
Apache Junction High School offers enrollment in grades 9-12 (No virtual instruction).
What school district is Apache Junction High School part of?
Apache Junction High School is part of Apache Junction Unified District (4443).
School Reviews
Review Apache Junction High School. Reviews should be a few sentences in length. Please include any comments on:
- Quality of academic programs, teachers, and facilities
- Availability of music, art, sports and other extracurricular activities
Recent Articles

Gifted, Honors, and Advanced Tracks: Are They Accessible or Just Advertised?
Learn how to evaluate gifted, honors, and advanced academic programs in public schools, including admission criteria, equity, and the questions every parent should ask.

Algebra Readiness: What Parents Should Ask Before Middle School
Discover how to determine if your child is ready for algebra before middle school, including the questions parents should ask and the skills students need to succeed.

How to Evaluate Reading Instruction in Your Zoned Elementary School
Learn how to evaluate reading instruction in your neighborhood elementary school by recognizing effective literacy practices, asking the right questions, and understanding what quality reading instruction looks like.


")


