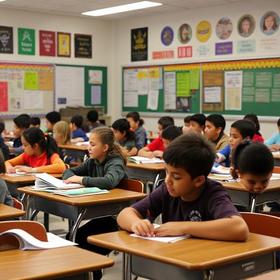
Serving 354 students in grades 7-8, Central Jr High School ranks in the top 50% of all schools in Illinois for overall test scores (math proficiency is bottom 50%, and reading proficiency is bottom 50%).
The percentage of students achieving proficiency in math is 21% (which is lower than the Illinois state average of 27%). The percentage of students achieving proficiency in reading/language arts is 31% (which is higher than the Illinois state average of 30%).
The student-teacher ratio of 15:1 is higher than the Illinois state level of 13:1.
Minority enrollment is 56% of the student body (majority Black), which is higher than the Illinois state average of 55% (majority Hispanic and Black).
Quick Facts (2025-26)
- Grades: 7-8
- Enrollment: 354 students
- Student-Teacher Ratio: 15:1
- Minority Enrollment: 56%
- Overall Testing Rank: Top 50% in IL
- Math Proficiency: 21% (Btm 50%)
- Reading Proficiency: 31% (Top 50%)
- Science Proficiency: 45-49% (Btm 50%)
- Source: National Center for Education Statistics (NCES), IL Dept. of Education
Top Rankings
Central Jr High School ranks among the top 20% of public schools in Illinois for:
Category
Attribute
Diversity
School Overview
Central Jr High School's student population of 354 students has declined by 13% over five school years.
The teacher population of 24 teachers has declined by 7% over five school years.
Grades Offered
Grades 7-8
Total Students
354 students
Gender %
Total Classroom Teachers
24 teachers
School Calendar
School Rankings
Central Jr High School ranks within the top 50% of all 3,542 schools in Illinois (based off of combined math and reading proficiency testing data).
The diversity score of Central Jr High School is 0.64, which is less than the diversity score at state average of 0.69. The school's diversity has stayed relatively flat over five school years.
Overall Testing Rank
#1636 out of 3542 schools
(Top 50%)
(Top 50%)
Math Test Scores (% Proficient)
21%
27%
Reading/Language Arts Test Scores (% Proficient)
31%
30%
Science Test Scores (% Proficient)
45-49%
50%
Student-Teacher Ratio
15:1
13:1
American Indian
n/a
n/a
Asian
n/a
6%
Hispanic
9%
28%
Black
40%
17%
White
44%
45%
Hawaiian
n/a
n/a
Two or more races
7%
4%
All Ethnic Groups
Eligible for Free Lunch
54%
43%
Eligible for Reduced Lunch
15%
4%
School Statewide Testing
School District Name
Source: National Center for Education Statistics (NCES), IL Dept. of Education
Profile last updated: 02/09/2025
Frequently Asked Questions
What is Central Jr High School's ranking?
Central Jr High School is ranked #1636 out of 3,542 schools, which ranks it among the top 50% of public schools in Illinois.
What percent of students have achieved state testing proficiency in math and reading?
21% of students have achieved math proficiency (compared to the 27% IL state average), while 31% of students have achieved reading proficiency (compared to the 30% IL state average).
How many students attend Central Jr High School?
354 students attend Central Jr High School.
What is the racial composition of the student body?
44% of Central Jr High School students are White, 40% of students are Black, 9% of students are Hispanic, and 7% of students are Two or more races.
What is the student-teacher ratio of Central Jr High School?
Central Jr High School has a student ration of 15:1, which is higher than the Illinois state average of 13:1.
What grades does Central Jr High School offer ?
Central Jr High School offers enrollment in grades 7-8
What school district is Central Jr High School part of?
Central Jr High School is part of Belleville School District 118.
School Reviews
Review Central Jr High School. Reviews should be a few sentences in length. Please include any comments on:
- Quality of academic programs, teachers, and facilities
- Availability of music, art, sports and other extracurricular activities
Recent Articles

How Public Schools Support Students on Free / Reduced-Lunch Programs
Explore how U.S. public schools support students eligible for free or reduced-price lunch through nutrition, academic, and wraparound services in 2025.

Hidden Costs of Public Schools: Fees, Supplies & Extras
Explore the hidden costs in public schools—fees, supplies, extracurriculars—and how parents can plan for them in 2025.

Public School Funding 2025: What Families Should Know
Essential insights on public school funding in 2025—how it works, what’s changing, and what families should know to stay ahead.


