Lehigh Valley Charter High School for the Arts, or Charter Arts, is an audition-based, tuition-free public charter school located in downtown Bethlehem, Pennsylvania in the Lehigh Valley region of eastern Pennsylvania.
Serving 524 students in grades 9-12, Lehigh Valley Charter High School For The Arts ranks in the top 30% of all schools in Pennsylvania for overall test scores (math proficiency is bottom 50%, and reading proficiency is bottom 50%).
The percentage of students achieving proficiency in math is 30-34% (which is lower than the Pennsylvania state average of 38%). The percentage of students achieving proficiency in reading/language arts is 90-94% (which is higher than the Pennsylvania state average of 55%).
The student-teacher ratio of 9:1 is lower than the Pennsylvania state level of 13:1.
Minority enrollment is 41% of the student body (majority Hispanic), which is higher than the Pennsylvania state average of 39% (majority Hispanic).
Quick Facts (2026)
- School Type: Charter School
- Grades: 9-12
- Enrollment: 524 students
- Student-Teacher Ratio: 9:1
- Minority Enrollment: 41%
- Graduation Rate: ≥95% (Top 10% in PA)
- Overall Testing Rank: Top 30%
- Math Proficiency: 30-34% (Btm 50%)
- Reading Proficiency: 90-94% (Top 1%)
- Science Proficiency: 60-79% (Top 50%)
- Source: National Center for Education Statistics (NCES), PA Dept. of Education
Top Rankings
Lehigh Valley Charter High School For The Arts ranks among the top 20% of public schools in Pennsylvania for:
Category
Attribute
Most improved public schools
Reading/Language Arts Proficiency
Graduation Rate
Diversity
Student Attention
School Overview
Lehigh Valley Charter High School For The Arts's student population of 524 students has declined by 17% over five school years.
The teacher population of 56 teachers has declined by 6% over five school years.
School Type
Grades Offered
Grades 9-12
(No virtual instruction)
(No virtual instruction)
Total Students
524 students
Gender %
Total Classroom Teachers
56 teachers
Year Founded
2003
School Calendar
School Motto
The Lehigh Valley Charter High School for the Arts provides a unique environment that fosters a creative academic approach to learning and a development of talent in the arts.
School Rankings
Lehigh Valley Charter High School For The Arts ranks within the top 30% of all 2,733 schools in Pennsylvania (based off of combined math and reading proficiency testing data).
The diversity score of Lehigh Valley Charter High School For The Arts is 0.59, which is equal to the diversity score at state average of 0.59. The school's diversity has stayed relatively flat over five school years.
Overall Testing Rank
#786 out of 2733 schools
(Top 30%)
(Top 30%)
Math Test Scores (% Proficient)
30-34%
38%
Reading/Language Arts Test Scores (% Proficient)
90-94%
55%
Science Test Scores (% Proficient)
60-79%
57%
Student-Teacher Ratio
9:1
13:1
American Indian
n/a
n/a
Asian
3%
5%
Hispanic
24%
15%
Black
11%
14%
White
59%
61%
Hawaiian
n/a
n/a
Two or more races
3%
5%
All Ethnic Groups
Graduation Rate
≥95%
87%
Eligible for Free Lunch
27%
60%
Eligible for Reduced Lunch (05-06)
13%
7%
School Statewide Testing
School District Name
Source: National Center for Education Statistics (NCES), PA Dept. of Education
Profile last updated: 02/09/2025
Frequently Asked Questions
What is Lehigh Valley Charter High School For The Arts's ranking?
Lehigh Valley Charter High School For The Arts is ranked #786 out of 2,733 schools, which ranks it among the top 30% of public schools in Pennsylvania.
What schools are Lehigh Valley Charter High School For The Arts often compared to?
Lehigh Valley Charter High School For The Artsis often viewed alongside schools like Lehigh Valley Academy Regional Charter School by visitors of our site.
What percent of students have achieved state testing proficiency in math and reading?
30-34% of students have achieved math proficiency (compared to the 38% PA state average), while 90-94% of students have achieved reading proficiency (compared to the 55% PA state average).
What is the graduation rate of Lehigh Valley Charter High School For The Arts?
The graduation rate of Lehigh Valley Charter High School For The Arts is 95%, which is higher than the Pennsylvania state average of 87%.
How many students attend Lehigh Valley Charter High School For The Arts?
524 students attend Lehigh Valley Charter High School For The Arts.
What is the racial composition of the student body?
59% of Lehigh Valley Charter High School For The Arts students are White, 24% of students are Hispanic, 11% of students are Black, 3% of students are Asian, and 3% of students are Two or more races.
What is the student-teacher ratio of Lehigh Valley Charter High School For The Arts?
Lehigh Valley Charter High School For The Arts has a student ration of 9:1, which is lower than the Pennsylvania state average of 13:1.
What grades does Lehigh Valley Charter High School For The Arts offer ?
Lehigh Valley Charter High School For The Arts offers enrollment in grades 9-12 (No virtual instruction).
What school district is Lehigh Valley Charter High School For The Arts part of?
Lehigh Valley Charter High School For The Arts is part of Lehigh Valley Charter High School For The Arts School District.
In what neighborhood is Lehigh Valley Charter High School For The Arts located?
Lehigh Valley Charter High School For The Arts is located in the South Side Historic District neighborhood of Bethlehem, PA.
School Reviews
5 10/10/2025
I am a student and it is an amazing school. Many people have the idea that the academics are horrible, but they have improved immensely since the school first opened 10 years ago. The theatre is far more advanced than any local theatre classes, and the academic work is just as strenuous.
5 10/10/2025
This school is fantastic! I feel like my art is really turning into something special every day I am here. Even in the virtual world we are able to make special connections with our teachers, and although some teachers may be hard to deal with (Madame Gournet), it''s genuinely a wonderful school. I highly recommend coming here, just maybe not take French!
Review Lehigh Valley Charter High School For The Arts. Reviews should be a few sentences in length. Please include any comments on:
- Quality of academic programs, teachers, and facilities
- Availability of music, art, sports and other extracurricular activities
Recent Articles

Public School Transportation & Commute Planning Guide
Learn how public school transportation and commute planning can help families prepare for the coming school year safely and efficiently.

New Public School Safety Protocols 2025–26 Guide
Learn how new public school safety protocols for 2025–26 affect students, parents, and schools nationwide.

How Technology Transforms Education in 2025
Explore how technology shapes learning today, with updated data, policy context, trends, and real-world implications for students, educators, and families.

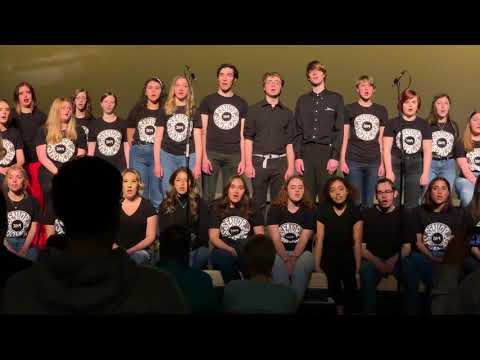
, which is located in the heart of South Bethlehem’s thriving arts district . This culture combined with the school’s rigorous curriculum fosters both artistic and academic success for its students.Charter Arts continues its eighteen-year legacy as one of the most respected high schools for arts in the nation. Among its many prestigious accolades, the school was named a 2018 Blue Ribbon School of Excellence by the U.S. Department of Education.Learn more: www.CharterArts.org 321 East 3rd. Street, Bethlehem")


")