


Do you crave a more personalized approach to education?
Are you
looking for a more flexible and convenient way to learn?
Are you
ready to break free from traditional education while at the same
time earning your high school diploma and preparing for college and
a career from home?
Look no further.
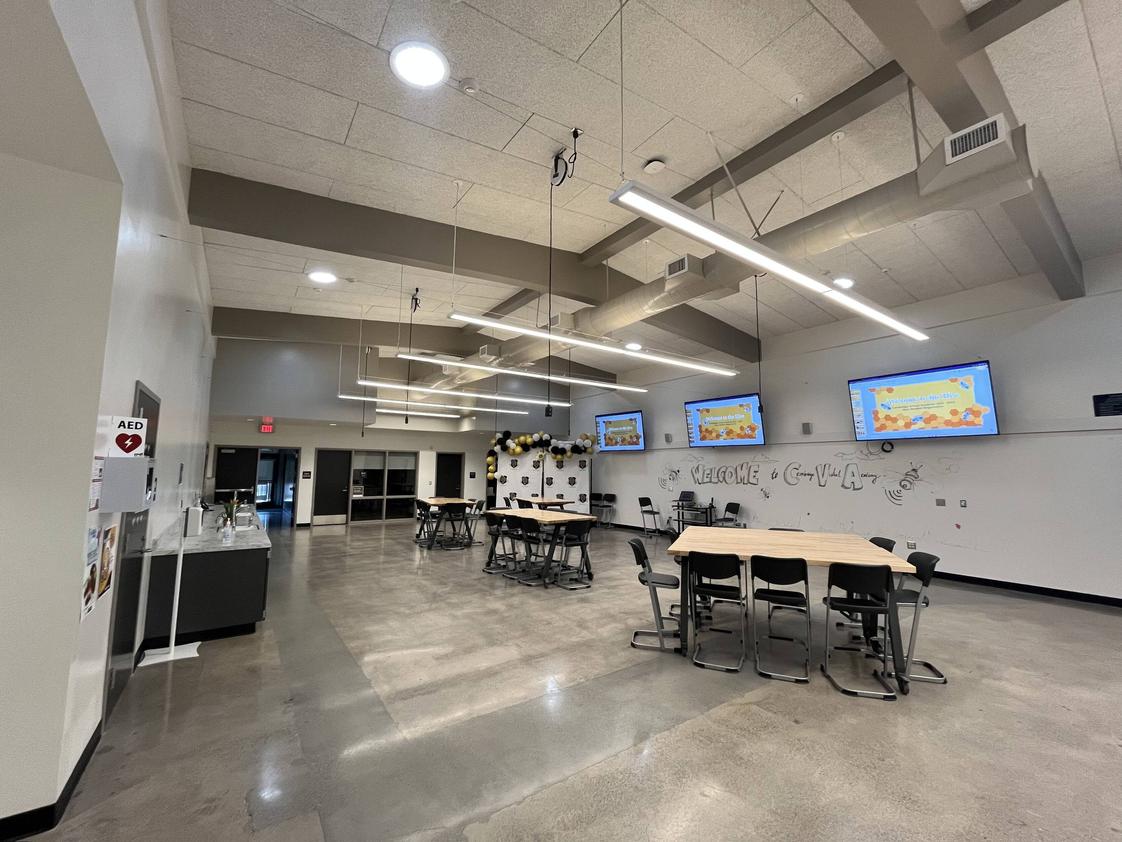
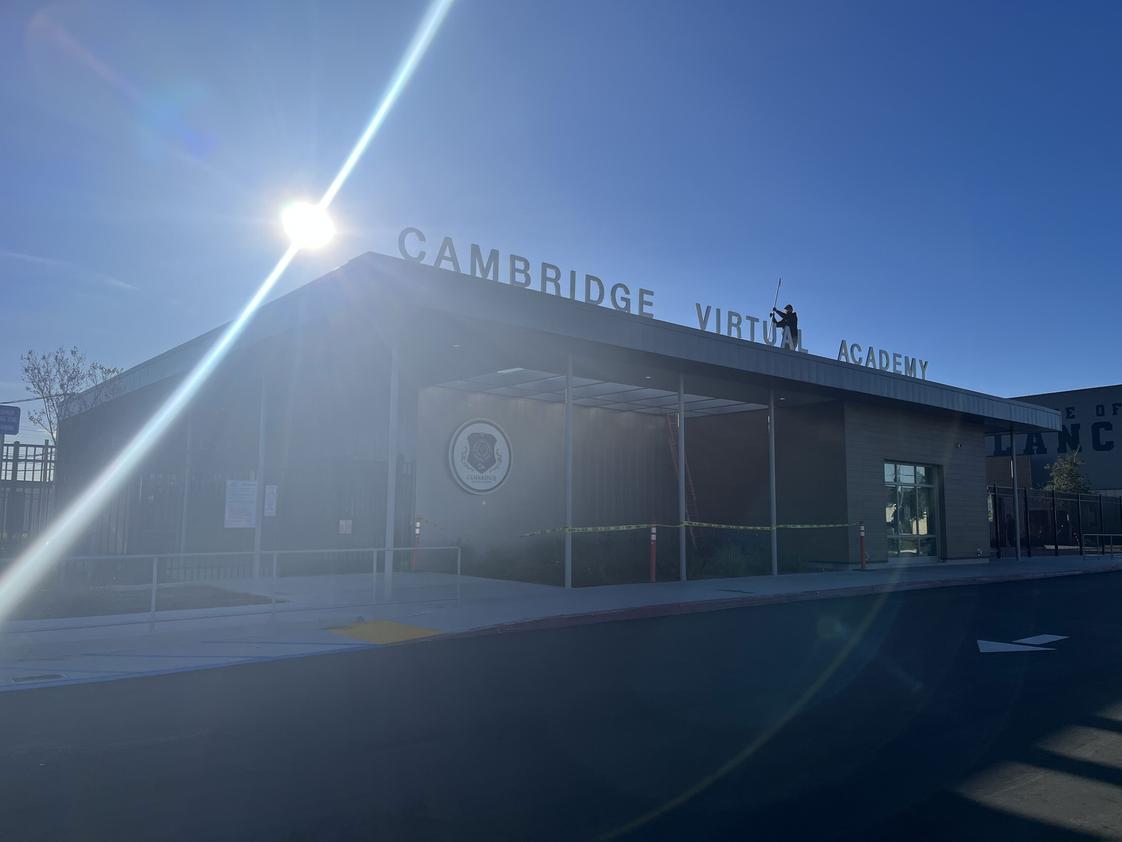
Discover a whole new world of
learning with Cambridge Virtual Academy (CVA).
Our exclusive
tuition-free virtual academy offers an independent study curriculum
like no other, designed to prepare you for the future.
With
challenging AP and Honors courses, internships, career pathways,
and dual enrollment for college credit, we provide an education
that's truly innovative.
But that's not all - our non-traditional
flexible schedule, distinctive electives like Mindfulness, Computer
Science, Ethnic Studies, Exploring Entrepreneurship, Google
Certificates, and the ability to concurrently enroll in your home
school for athletics and visual and performing arts set us apart
from the rest.
At CVA, we don't just teach; we empower our students
to take control of their education and their personal passions and
interests.
We cater to a wide variety of students, from athletes
and entertainers to students and families who travel or need to
stay home for remote work.
Our boutique approach ensures a
personalized experience, with teachers who go above and beyond to
support your unique story.
Our exemplary online teachers have been
trained in the National Online Teaching Standards to provide the
best quality instruction and a safe, nurturing, engaging,
environment.
Plus, our partnership with over 70 corporations and
businesses offers our students unparalleled access to relevant
career experiences.
And if that's not enough, our Anaheim Union
High School District's Educational Pledge guarantees admission to
UCI when conditions are met.
So, if you're ready to take your
education to the next level, join the Beehive at Cambridge Virtual
Academy - your education adventure is waiting for you!
Quick Facts (2026)
- School Type: Alternative school
- Grades: 7-12
- Enrollment: 623 students
- Student-Teacher Ratio: 21:1
- Minority Enrollment: 90%
- Graduation Rate: 84% (Btm 50% in CA)
- Overall Testing Rank: Bottom 50%
- Math Proficiency: 6-9% (Btm 50%)
- Reading Proficiency: 30-34% (Btm 50%)
- Science Proficiency: 19% (Btm 50%)
- Source: National Center for Education Statistics (NCES), CA Dept. of Education
School Overview
Polaris High School's student population of 623 students has stayed relatively flat over five school years.
The teacher population of 30 teachers has declined by 21% over five school years.
School Type
Grades Offered
Grades 7-12
Total Students
623 students
Total Classroom Teachers
30 teachers
School Calendar
School Rankings
Polaris High School ranks within the bottom 50% of all 9,523 schools in California (based off of combined math and reading proficiency testing data).
The diversity score of Polaris High School is 0.33, which is less than the diversity score at state average of 0.63. The school's diversity has stayed relatively flat over five school years.
Overall Testing Rank
#8068 out of 9523 schools
(Bottom 50%)
(Bottom 50%)
Math Test Scores (% Proficient)
6-9%
34%
Reading/Language Arts Test Scores (% Proficient)
30-34%
47%
Science Test Scores (% Proficient)
19%
29%
Student-Teacher Ratio
21:1
21:1
American Indian
n/a
1%
Asian
4%
12%
Hispanic
81%
56%
Black
2%
5%
White
10%
20%
Hawaiian
1%
n/a
Two or more races
2%
6%
All Ethnic Groups
Graduation Rate
84%
87%
Chronically Absent Students
(22-23)n/a
27.7%
Eligible for Free Lunch
78%
54%
Eligible for Reduced Lunch
10%
8%
School Statewide Testing
School District Name
Extracurriculars
Total ExtracurricularsTotal Extra-curric.
2 extracurriculars
ExtracurricularsExtra-curric.
Club or Organization:
ASBRSVP
Source: National Center for Education Statistics (NCES), CA Dept. of Education
School Notes
- School Mascot: Bees
- CVA will develop young scholars into compassionate innovators, critical thinkers, and problem solvers who will lead and succeed in all levels of society.
Profile last updated: 01/27/2026
Frequently Asked Questions
What is Polaris High School's ranking?
Polaris High School is ranked #8068 out of 9,523 schools, which ranks it among the bottom 50% of public schools in California.
What percent of students have achieved state testing proficiency in math and reading?
6-9% of students have achieved math proficiency (compared to the 34% CA state average), while 30-34% of students have achieved reading proficiency (compared to the 47% CA state average).
What is the graduation rate of Polaris High School?
The graduation rate of Polaris High School is 84%, which is lower than the California state average of 87%.
How many students attend Polaris High School?
623 students attend Polaris High School.
What is the racial composition of the student body?
81% of Polaris High School students are Hispanic, 10% of students are White, 4% of students are Asian, 2% of students are Black, 2% of students are Two or more races, and 1% of students are Hawaiian.
What is the student-teacher ratio of Polaris High School?
Polaris High School has a student ration of 21:1, which is equal to the California state average of 21:1.
What grades does Polaris High School offer ?
Polaris High School offers enrollment in grades 7-12
What school district is Polaris High School part of?
Polaris High School is part of Anaheim Union High School District.
In what neighborhood is Polaris High School located?
Polaris High School is located in the Hermosa Village neighborhood of Anaheim, CA. There are 5 other public schools located in Hermosa Village.
School Reviews
5 10/10/2025
Cambridge Virtual Academy is amazing for my student, she is always encouraged to engage in social and extracurricular events even though it is a virtual school. She has top-of-the-line teachers who genuinely care about her.
Review Polaris High School. Reviews should be a few sentences in length. Please include any comments on:
- Quality of academic programs, teachers, and facilities
- Availability of music, art, sports and other extracurricular activities
Recent Articles

Gifted, Honors, and Advanced Tracks: Are They Accessible or Just Advertised?
Learn how to evaluate gifted, honors, and advanced academic programs in public schools, including admission criteria, equity, and the questions every parent should ask.

Algebra Readiness: What Parents Should Ask Before Middle School
Discover how to determine if your child is ready for algebra before middle school, including the questions parents should ask and the skills students need to succeed.

How to Evaluate Reading Instruction in Your Zoned Elementary School
Learn how to evaluate reading instruction in your neighborhood elementary school by recognizing effective literacy practices, asking the right questions, and understanding what quality reading instruction looks like.


")


