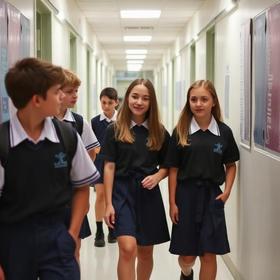
Northside College Preparatory High School is a public four-year selective enrollment high school located in the North Park neighborhood on the north side of Chicago, Illinois, United States. Founded in 1999, it was the first new CPS high school to be built in 20 years.
Serving 1,032 students in grades 9-12, Northside College Preparatory High School ranks in the top 1% of all schools in Illinois for overall test scores (math proficiency is top 1%, and reading proficiency is top 1%).
The percentage of students achieving proficiency in math is 93% (which is higher than the Illinois state average of 27%). The percentage of students achieving proficiency in reading/language arts is 90% (which is higher than the Illinois state average of 30%).
The student-teacher ratio of 14:1 is higher than the Illinois state level of 13:1.
Minority enrollment is 63% of the student body (majority Hispanic and Asian), which is higher than the Illinois state average of 55% (majority Hispanic and Black).
Quick Facts (2026)
- Grades: 9-12
- Enrollment: 1,032 students
- Student-Teacher Ratio: 14:1
- Minority Enrollment: 63%
- Graduation Rate: 97% (Top 1% in IL)
- Overall Testing Rank: Top 1%
- Math Proficiency: 93% (Top 1%)
- Reading Proficiency: 90% (Top 1%)
- Science Proficiency: 92% (Top 1%)
- Source: National Center for Education Statistics (NCES), IL Dept. of Education
Top Rankings
Northside College Preparatory High School ranks among the top 20% of public schools in Illinois for:
Category
Attribute
Overall Rank
Math Proficiency
Reading/Language Arts Proficiency
Science Proficiency
Graduation Rate
Diversity
School Overview
Northside College Preparatory High School's student population of 1,032 students has stayed relatively flat over five school years.
The teacher population of 72 teachers has grown by 24% over five school years.
Grades Offered
Grades 9-12
Total Students
1,032 students
Gender %
Total Classroom Teachers
72 teachers
Year Founded
1999
Colors
Maroon, Silver
School Calendar
Last Day of School
Sat. May 30, 2026
School Motto
Taking The Road Less Traveled
School Rankings
Northside College Preparatory High School ranks within the top 1% of all 3,542 schools in Illinois (based off of combined math and reading proficiency testing data).
The diversity score of Northside College Preparatory High School is 0.74, which is more than the diversity score at state average of 0.69. The school's diversity has stayed relatively flat over five school years.
Overall Testing Rank
#3 out of 3542 schools
(Top 1%)
(Top 1%)
Math Test Scores (% Proficient)
93%
27%
Reading/Language Arts Test Scores (% Proficient)
90%
30%
Science Test Scores (% Proficient)
92%
50%
Student-Teacher Ratio
14:1
13:1
American Indian
n/a
n/a
Asian
21%
6%
Hispanic
28%
28%
Black
7%
17%
White
37%
45%
Hawaiian
1%
n/a
Two or more races
6%
4%
All Ethnic Groups
Graduation Rate
97%
87%
Eligible for Free Lunch
43%
43%
Eligible for Reduced Lunch (13-14)
9%
3%
School Statewide Testing
School District Name
Source: National Center for Education Statistics (NCES), IL Dept. of Education
School Notes
- School Mascot: Mustang
Frequently Asked Questions
What is Northside College Preparatory High School's ranking?
Northside College Preparatory High School is ranked #3 out of 3,542 schools, which ranks it among the top 1% of public schools in Illinois.
What schools are Northside College Preparatory High School often compared to?
Northside College Preparatory High Schoolis often viewed alongside schools like Payton College Preparatory High School by visitors of our site.
What percent of students have achieved state testing proficiency in math and reading?
93% of students have achieved math proficiency (compared to the 27% IL state average), while 90% of students have achieved reading proficiency (compared to the 30% IL state average).
What is the graduation rate of Northside College Preparatory High School?
The graduation rate of Northside College Preparatory High School is 97%, which is higher than the Illinois state average of 87%.
How many students attend Northside College Preparatory High School?
1,032 students attend Northside College Preparatory High School.
What is the racial composition of the student body?
37% of Northside College Preparatory High School students are White, 28% of students are Hispanic, 21% of students are Asian, 7% of students are Black, 6% of students are Two or more races, and 1% of students are Hawaiian.
What is the student-teacher ratio of Northside College Preparatory High School?
Northside College Preparatory High School has a student ration of 14:1, which is higher than the Illinois state average of 13:1.
What grades does Northside College Preparatory High School offer ?
Northside College Preparatory High School offers enrollment in grades 9-12
What school district is Northside College Preparatory High School part of?
Northside College Preparatory High School is part of Chicago Public Schools District 299.
In what neighborhood is Northside College Preparatory High School located?
Northside College Preparatory High School is located in the North Park neighborhood of Chicago, IL. There are 5 other public schools located in North Park.
School Reviews
Review Northside College Preparatory High School. Reviews should be a few sentences in length. Please include any comments on:
- Quality of academic programs, teachers, and facilities
- Availability of music, art, sports and other extracurricular activities
Recent Articles

Helping Your Child Navigate Friendship Drama at School
Meta Description: Practical 2026 strategies for helping your child navigate friendship drama at school with confidence, empathy, and resilience.

Raising Kind Kids: Public Schools and Empathy
Discover How Public Schools Teach Empathy and Character Education through SEL, service learning, and restorative practices in 2026.

Do We Still Need Libraries in Public Schools in 2026
An updated look at the role of public school libraries in 2026, their impact on literacy, equity, and digital learning, and why they remain essential today.


