Serving 222 students in grades Prekindergarten-12, Woodsedge Learning Center ranks in the top 20% of all schools in Michigan for overall test scores (math proficiency is top 10%, and reading proficiency is top 10%).
The percentage of students achieving proficiency in math is 60-64% (which is higher than the Michigan state average of 35%). The percentage of students achieving proficiency in reading/language arts is 55-59% (which is higher than the Michigan state average of 45%).
The student-teacher ratio of 9:1 is lower than the Michigan state level of 16:1.
Minority enrollment is 44% of the student body (majority Black), which is higher than the Michigan state average of 37% (majority Black).
Quick Facts (2026)
- School Type: Special education school
- Grades: Prekindergarten-12
- Enrollment: 222 students
- Student-Teacher Ratio: 9:1
- Minority Enrollment: 44%
- Graduation Rate: <50% (Btm 50% in MI)
- Overall Testing Rank: Top 20%
- Math Proficiency: 60-64% (Top 10%)
- Reading Proficiency: 55-59% (Top 30%)
- Science Proficiency: 60-69% (Top 10%)
- Source: National Center for Education Statistics (NCES), MI Dept. of Education
Top Rankings
Woodsedge Learning Center ranks among the top 20% of public schools in Michigan for:
Category
Attribute
Overall Rank
Math Proficiency
Science Proficiency
School Overview
Woodsedge Learning Center's student population of 222 students has grown by 12% over five school years.
The teacher population of 26 teachers has declined by 23% over five school years.
School Type
Grades Offered
Grades Prekindergarten-12
(No virtual instruction)
(No virtual instruction)
Total Students
222 students
Total Classroom Teachers
26 teachers
School Calendar
School Rankings
Woodsedge Learning Center ranks within the top 20% of all 3,025 schools in Michigan (based off of combined math and reading proficiency testing data).
The diversity score of Woodsedge Learning Center is 0.62, which is more than the diversity score at state average of 0.57. The school's diversity has stayed relatively flat over five school years.
Overall Testing Rank
#412 out of 3025 schools
(Top 20%)
(Top 20%)
Math Test Scores (% Proficient)
60-64%
35%
Reading/Language Arts Test Scores (% Proficient)
55-59%
45%
Science Test Scores (% Proficient)
60-69%
38%
Student-Teacher Ratio
9:1
16:1
American Indian
n/a
1%
Asian
1%
4%
Hispanic
10%
9%
Black
24%
18%
White
56%
63%
Hawaiian
n/a
n/a
Two or more races
9%
5%
All Ethnic Groups
Graduation Rate
<50%
81%
Chronically Absent Students
(22-23)38.7%
33.3%
Participates in the National School Lunch Program (NSLP)
Yes
Eligible for Free Lunch
50%
45%
Eligible for Reduced Lunch
2%
4%
School Statewide Testing
School District Name
Source: National Center for Education Statistics (NCES), MI Dept. of Education
Frequently Asked Questions
What is Woodsedge Learning Center's ranking?
Woodsedge Learning Center is ranked #412 out of 3,025 schools, which ranks it among the top 20% of public schools in Michigan.
What percent of students have achieved state testing proficiency in math and reading?
60-64% of students have achieved math proficiency (compared to the 35% MI state average), while 55-59% of students have achieved reading proficiency (compared to the 45% MI state average).
What is the graduation rate of Woodsedge Learning Center?
The graduation rate of Woodsedge Learning Center is 50%, which is lower than the Michigan state average of 81%.
How many students attend Woodsedge Learning Center?
222 students attend Woodsedge Learning Center.
What is the racial composition of the student body?
56% of Woodsedge Learning Center students are White, 24% of students are Black, 10% of students are Hispanic, 9% of students are Two or more races, and 1% of students are Asian.
What is the student-teacher ratio of Woodsedge Learning Center?
Woodsedge Learning Center has a student ration of 9:1, which is lower than the Michigan state average of 16:1.
What grades does Woodsedge Learning Center offer ?
Woodsedge Learning Center offers enrollment in grades Prekindergarten-12 (No virtual instruction).
What school district is Woodsedge Learning Center part of?
Woodsedge Learning Center is part of Kalamazoo RESA School District.
School Reviews
Review Woodsedge Learning Center. Reviews should be a few sentences in length. Please include any comments on:
- Quality of academic programs, teachers, and facilities
- Availability of music, art, sports and other extracurricular activities
Recent Articles

Gifted, Honors, and Advanced Tracks: Are They Accessible or Just Advertised?
Learn how to evaluate gifted, honors, and advanced academic programs in public schools, including admission criteria, equity, and the questions every parent should ask.

Algebra Readiness: What Parents Should Ask Before Middle School
Discover how to determine if your child is ready for algebra before middle school, including the questions parents should ask and the skills students need to succeed.

How to Evaluate Reading Instruction in Your Zoned Elementary School
Learn how to evaluate reading instruction in your neighborhood elementary school by recognizing effective literacy practices, asking the right questions, and understanding what quality reading instruction looks like.

, and United Teens Talent, a workshop and performance of musical theatre and variety acts helping underserved youth experience the theatre process while building positive relationships.
~~~~~~~~~~~~~~~~~~~~
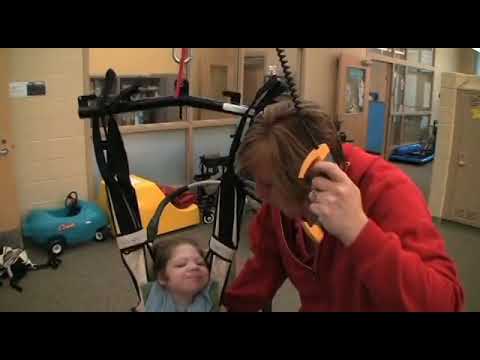
Music Therapy at WoodsEdge Learning Center
WoodsEdge Learning Center is a special education center-based school that provides service to all nine districts within Kalamazoo County for students who are between the ages of 3 and 26 years of age.
An innovative school dedicated to developing independence in their students, WoodsEdge uses Music Therapy as a means to help students build relationships and self-awareness.")


