For the 2026-27 school year, there are 10 public elementary schools serving 4,057 students in 76543, TX.
The top-ranked public elementary schools in 76543, TX are Ira Cross Jr Elementary School, Brookhaven Elementary School and Rancier Middle School. Overall testing rank is based on a school's combined math and reading proficiency test score ranking.
Public elementary schools in zipcode 76543 have an average math proficiency score of 26% (versus the Texas public elementary school average of 45%), and reading proficiency score of 33% (versus the 52% statewide average). Elementary schools in 76543, TX have an average ranking of 1/10, which is in the bottom 50% of Texas public elementary schools.
Minority enrollment is 88% of the student body (majority Hispanic and Black), which is more than the Texas public elementary school average of 76% (majority Hispanic).
Best 76543, TX Public Elementary Schools (2026-27)
School
(Math and Reading Proficiency)
(Math and Reading Proficiency)
Location
Quick Facts
Rank: #11.
Ira Cross Jr Elementary School
(Math: 43% | Reading: 47%)
Rank:
Rank:
5/
Bottom 50%10
1910 Herndon Dr
Killeen, TX 76543
(254) 336-2550
Killeen, TX 76543
(254) 336-2550
Gr: PK-5 | 642 students Student-teacher ratio: 14:1 Minority enrollment: 91%
Rank: #22.
Brookhaven Elementary School
(Math: 37% | Reading: 43%)
Rank:
Rank:
4/
Bottom 50%10
3221 Hilliard Ave
Killeen, TX 76543
(254) 336-1440
Killeen, TX 76543
(254) 336-1440
Gr: PK-5 | 503 students Student-teacher ratio: 14:1 Minority enrollment: 87%
Rank: #33.
Rancier Middle School
(Math: 23% | Reading: 33%)
Rank:
Rank:
2/
Bottom 50%10
3301 Hilliard Ave
Killeen, TX 76543
(254) 336-1250
Killeen, TX 76543
(254) 336-1250
Gr: 6-8 | 735 students Student-teacher ratio: 17:1 Minority enrollment: 89%
Rank: #44.
Hay Branch Elementary School
(Math: 20% | Reading: 31%)
Rank:
Rank:
1/
Bottom 50%10
6101 Westcliff Rd
Killeen, TX 76543
(254) 336-2080
Killeen, TX 76543
(254) 336-2080
Gr: PK-5 | 522 students Student-teacher ratio: 15:1 Minority enrollment: 89%
Rank: #55.
Peebles Elementary School
(Math: 19% | Reading: 30%)
Rank:
Rank:
1/
Bottom 50%10
1800 N W S Young Dr
Killeen, TX 76543
(254) 336-2120
Killeen, TX 76543
(254) 336-2120
Gr: PK-5 | 458 students Student-teacher ratio: 12:1 Minority enrollment: 90%
Rank: #66.
Manor Middle School
(Math: 21% | Reading: 26%)
Rank:
Rank:
1/
Bottom 50%10
1700 S W S Young Dr
Killeen, TX 76543
(254) 336-1310
Killeen, TX 76543
(254) 336-1310
Gr: 6-8 | 592 students Student-teacher ratio: 14:1 Minority enrollment: 86%
Rank: n/an/a
200 N Ws Young Dr
Killeen, TX 76543
(254) 336-0006
Killeen, TX 76543
(254) 336-0006
Gr: 6-8 | 557 students Student-teacher ratio: 19:1 Minority enrollment: 83%
Rank: n/an/a
Gateway Middle School
Alternative School
1307 Gowen Dr
Killeen, TX 76543
(254) 336-1690
Killeen, TX 76543
(254) 336-1690
Gr: 6-8 | 48 students Student-teacher ratio: 3:1 Minority enrollment: 94%
76543, Texas Public Schools (Closed)
School
Location
Quick Facts
Bell County Jjaep (Closed 2012)
Alternative School
306 College Ave
Killeen, TX 76543
(254) 793-2850
Killeen, TX 76543
(254) 793-2850
Gr: K-12
Bell County Juv Det Center (Closed 2018)
Alternative School
4800 E Rancier Ave
Killeen, TX 76543
(254) 618-4268
Killeen, TX 76543
(254) 618-4268
Gr: 6-11 | 27 students Student-teacher ratio: 9:1 Minority enrollment: 82%
4100 Zephyr Rd
Killeen, TX 76543
(254) 501-1680
Killeen, TX 76543
(254) 501-1680
Gr: PK-5 | 486 students Student-teacher ratio: 12:1 Minority enrollment: 82%
902 Rev R A Abercombie Dr
Killeen, TX 76543
(254) 501-1720
Killeen, TX 76543
(254) 501-1720
Gr: PK-5 | 258 students Minority enrollment: 73%
Frequently Asked Questions
What are the top-ranked public elementary schools in 76543, TX?
The top-ranked public elementary schools in 76543, TX include Ira Cross Jr Elementary School, Brookhaven Elementary School and Rancier Middle School.
How many public elementary schools are located in 76543?
10 public elementary schools are located in 76543.
What is the racial composition of students in 76543?
76543 public elementary schools minority enrollment is 88% of the student body (majority Hispanic and Black), which is more than the Texas public elementary schools average of 76% (majority Hispanic).
Recent Articles

How Much Choice Do High School Students Have?
Learn how graduation requirements, prerequisites, electives, staffing, scheduling conflicts, AP courses, dual enrollment, and career pathways determine how much control high school students have over schedules each year.

Does Your Child Need More Recess?
Explore whether your child may benefit more from recess than another academic period, including research on attention, learning, physical activity, stress, social development, and school-day balance today.
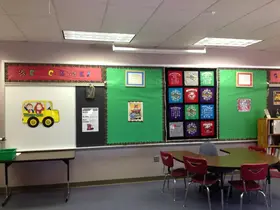
Combined Grade Classrooms, What Parents Should Know
Learn how combined-grade classrooms work, why public schools use them, potential benefits and challenges, and the questions parents should ask before enrolling their child in one today.