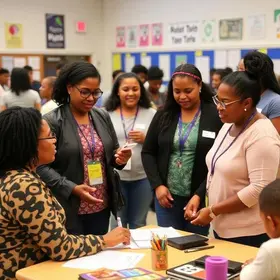
West Virginia is the #42 largest school system in the United States, serving 242,065 students across the 682 public schools for the 2026-27 school year (there are 125 private schools, serving 13,850 students). 95% of all K-12 students in West Virginia attend public schools, compared to the national average of 90%.
The percentage of students achieving math proficiency in West Virginia is 34%. The percentage of students achieving reading proficiency is 42%.
The top-ranked public schools in West Virginia are Greenmont Elementary School, Smithville Elementary School, and Sherman Elementary School. Overall testing rank is based on a school's combined math and reading proficiency test scores.
Minority enrollment is 13%, with the majority being Black and the student-teacher ratio is 14:1.
Top-Ranked Public Schools in West Virginia (2026-27)
School
(Math and Reading Proficiency)
(Math and Reading Proficiency)
Student Proficiency
Grades
Location
Rank: #1 - 21. - 2.
Greenmont Elementary School
(Math: 75-79% | Reading: 85-89%)
Rank:
Rank:
10/
Top 1%10
Math: 75-79% (Top 5%)
Reading: 85-89% (Top 1%)
Grades: PK-5
209 58th St
Vienna, WV 26105
(304) 420-9544
Vienna, WV 26105
(304) 420-9544
Rank: #1 - 21. - 2.
Smithville Elementary School
(Math: 80-89% | Reading: 60-79%)
Rank:
Rank:
10/
Top 1%10
Math: 80-89% (Top 1%)
Reading: 60-79% (Top 5%)
Grades: PK-4
157 Main Street
Smithville, WV 26178
(304) 477-3273
Smithville, WV 26178
(304) 477-3273
Rank: #33.
Sherman Elementary School
(Math: 85-89% | Reading: 65-69%)
Rank:
Rank:
10/
Top 1%10
Math: 85-89% (Top 1%)
Reading: 65-69% (Top 5%)
Grades: PK-5
7487 Coal River Road
Comfort, WV 25049
(304) 837-8310
Comfort, WV 25049
(304) 837-8310
Rank: #44.
Holz Elementary School
(Math: 75-79% | Reading: 75-79%)
Rank:
Rank:
10/
Top 1%10
Math: 75-79% (Top 5%)
Reading: 75-79% (Top 1%)
Grades: PK-5
1505 Hampton Rd
Charleston, WV 25314
(304) 348-1906
Charleston, WV 25314
(304) 348-1906
Rank: #55.
Criss Elementary School
(Math: 75-79% | Reading: 70-74%)
Rank:
Rank:
10/
Top 1%10
Math: 75-79% (Top 5%)
Reading: 70-74% (Top 1%)
Grades: PK-5
2800 22nd St
Parkersburg, WV 26101
(304) 420-9522
Parkersburg, WV 26101
(304) 420-9522
Rank: #66.
Hollywood Elementary School
(Math: 80-84% | Reading: 65-69%)
Rank:
Rank:
10/
Top 1%10
Math: 80-84% (Top 1%)
Reading: 65-69% (Top 5%)
Grades: PK-5
412 Old Mill Rd
Beckley, WV 25801
(304) 256-4590
Beckley, WV 25801
(304) 256-4590
Rank: #77.
West Teays Elementary School
(Math: 80% | Reading: 69%)
Rank:
Rank:
10/
Top 5%10
Math: 80% (Top 5%)
Reading: 69% (Top 5%)
Grades: PK-5
3676 Teays Valley Road
Hurricane, WV 25526
(304) 757-6711
Hurricane, WV 25526
(304) 757-6711
Rank: #88.
Evans Elementary School
(Math: 70-74% | Reading: 65-69%)
Rank:
Rank:
10/
Top 5%10
Math: 70-74% (Top 5%)
Reading: 65-69% (Top 5%)
Grades: PK-5
205 Schoolhouse Dr
Evans, WV 25241
(304) 372-7333
Evans, WV 25241
(304) 372-7333
Rank: #99.
Pleasant Valley Elementary School
(Math: 80-84% | Reading: 60-64%)
Rank:
Rank:
10/
Top 5%10
Math: 80-84% (Top 1%)
Reading: 60-64% (Top 5%)
Grades: PK-4
1858 Valley School Rd
Fairmont, WV 26554
(304) 367-2148
Fairmont, WV 26554
(304) 367-2148
Rank: #1010.
New Manchester Elementary School
(Math: 75-79% | Reading: 60-64%)
Rank:
Rank:
10/
Top 5%10
Math: 75-79% (Top 5%)
Reading: 60-64% (Top 5%)
Grades: PK-4
128 Frankfort Rd
New Cumberland, WV 26047
(304) 564-3242
New Cumberland, WV 26047
(304) 564-3242
Overview
This State (WV)
US
# Schools
682 Schools
100,278 Schools
# Students
242,065 Students
49,273,635 Students
# Teachers
18,080 Teachers
3,176,843 Teachers
Student-Teacher Ratio
14:1
15:1
Student By Grade
State Acdeamy
State Average (WV)
National Average
Math Test Scores (% Proficient)
34%
41%
Reading/Language Arts Test Scores (% Proficient)
43%
47%
Science Test Scores (% Proficient)
28%
43%
Graduation Rate
92.6%
87%
Eligible for Free Lunch
50%
50%
Eligible for Reduced Lunch
5%
5%
Students by Ethnicity:
Diversity Score
0.23
0.71
# American Indian Students
226 Students
465,603 Students
% American Indian Students
n/a
1%
# Asian Students
1,751 Students
2,805,335 Students
% Asian Students
1%
6%
# Hispanic Students
6,468 Students
14,933,054 Students
% Hispanic Students
3%
30%
# Black Students
10,369 Students
7,261,950 Students
% Black Students
4%
15%
# White Students
211,421 Students
20,989,112 Students
% White Students
87%
43%
# Hawaiian Students
151 Students
196,824 Students
% Hawaiian Students
n/a
n/a
# Two or more races Students
11,679 Students
2,585,771 Students
% of Two or more races Students
5%
5%
All Ethnic Groups
State Revenue and Spending
This State (WV)
Total Revenue
$4,251 MM
Spending
$4,144 MM
Revenue / Student
$17,559
Spending / Student
$17,118
Best West Virginia Public Schools by County (2026-27)
Popular neighborhoods: First Ward (3 schools), Davin (2 schools), Berryville (1 schools), North View (1 schools), Evansdale (1 schools).
County
# Schools
# Students
% Minority
Frequently Asked Questions
What are the top-ranked public schools in West Virginia?
The top-ranked public schools in West Virginia include Greenmont Elementary School, Smithville Elementary School, and Sherman Elementary School.
How many public schools are located in West Virginia?
682 public schools are located in West Virginia.
What percentage of students in West Virginia go to public school?
95% of all K-12 students in West Virginia attend public schools (compared to the national average of 90%).
What is the racial composition of students in West Virginia?
Minority enrollment in West Virginia is 13%, with the majority being Black.
Which public schools in West Virginia are often viewed compared to one another?
Popular comparisons of public schools in West Virginia include: New River Primary vs. Fayetteville Pk-8, Logan Senior High School vs. Chapmanville Regional High School, Frankfort High School vs. Keyser High School
Recent Articles

School Leadership Matters: Evaluating a Principal
Learn how to evaluate a public school principal before enrolling by examining leadership stability, teacher support, communication, school culture, instructional priorities, discipline, family engagement, and measurable improvement efforts.
Comparing Before- and After-School Programs
Learn how to compare before- and after-school programs when choosing a public school, including hours, costs, staffing, safety, activities, enrollment rules, transportation, meals, and daily convenience for families.
Choosing a Public School During Budget Uncertainty
Learn which questions parents should ask when choosing a public school during budget uncertainty, including staffing, programs, class sizes, transportation, reserves, enrollment trends, and planned reductions ahead.